Fig. 15
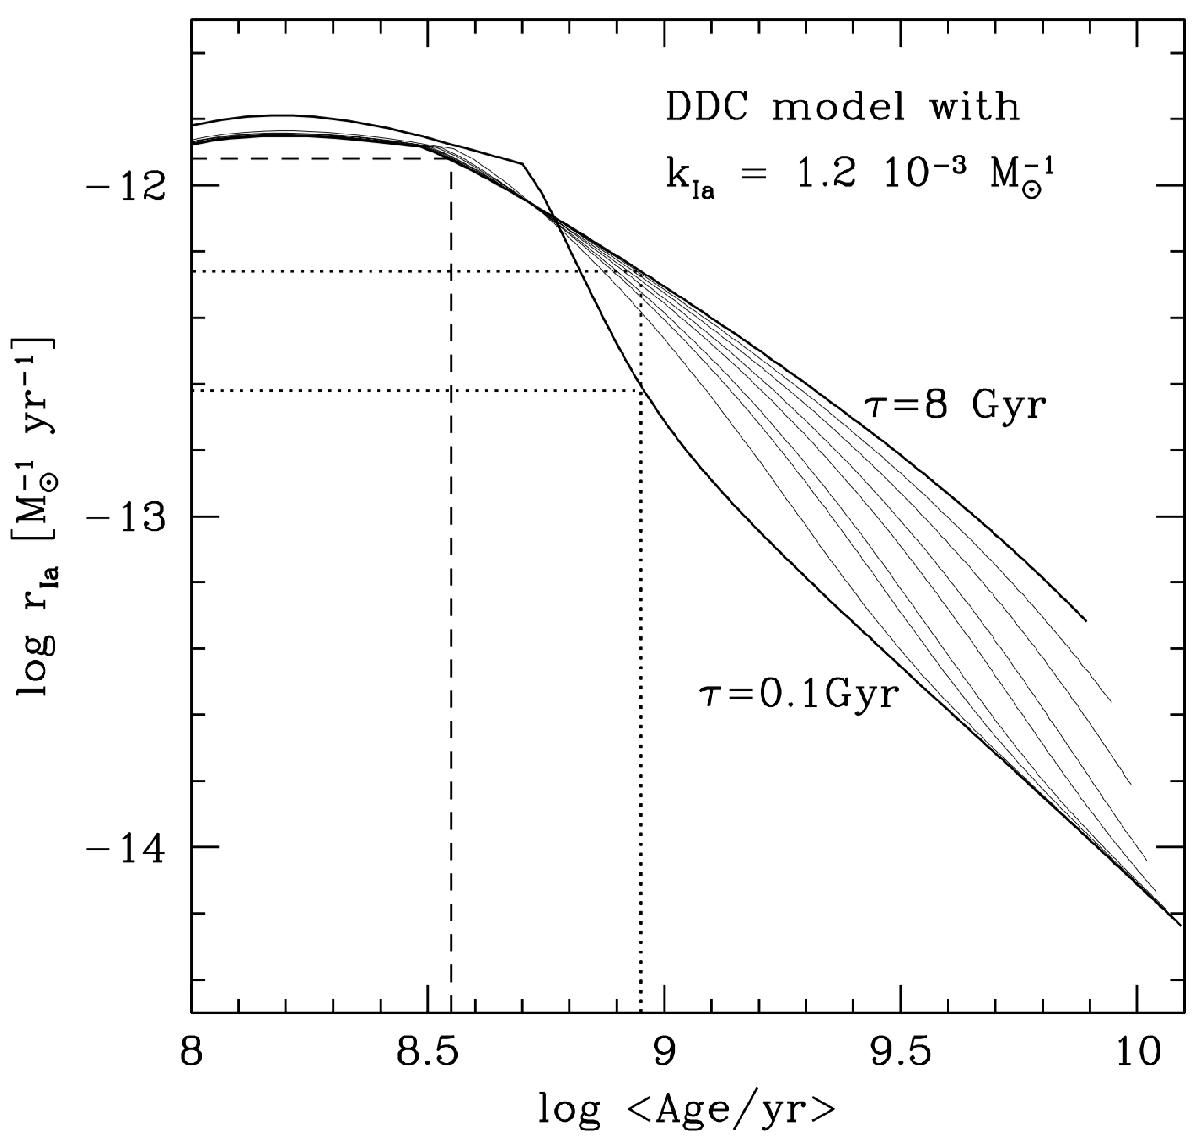
Relation between the SN Ia rate model and the average age of the stars in the parent galaxy, for exponentially declining SFHs and a DDC model description of the DTD. The different solid lines are obtained for different values of the e-folding SF timescale, ranging from 0.1 Gyr (lowermost curve) to 8 Gyr (uppermost curve). Along each line the parameter AGE increases from 0.05 to 12.5 Gyr. The dashed and dotted lines are drawn at the median average ages, respectively, of the least and the most massive bin in Fig. 14.
Current usage metrics show cumulative count of Article Views (full-text article views including HTML views, PDF and ePub downloads, according to the available data) and Abstracts Views on Vision4Press platform.
Data correspond to usage on the plateform after 2015. The current usage metrics is available 48-96 hours after online publication and is updated daily on week days.
Initial download of the metrics may take a while.