Fig. 14
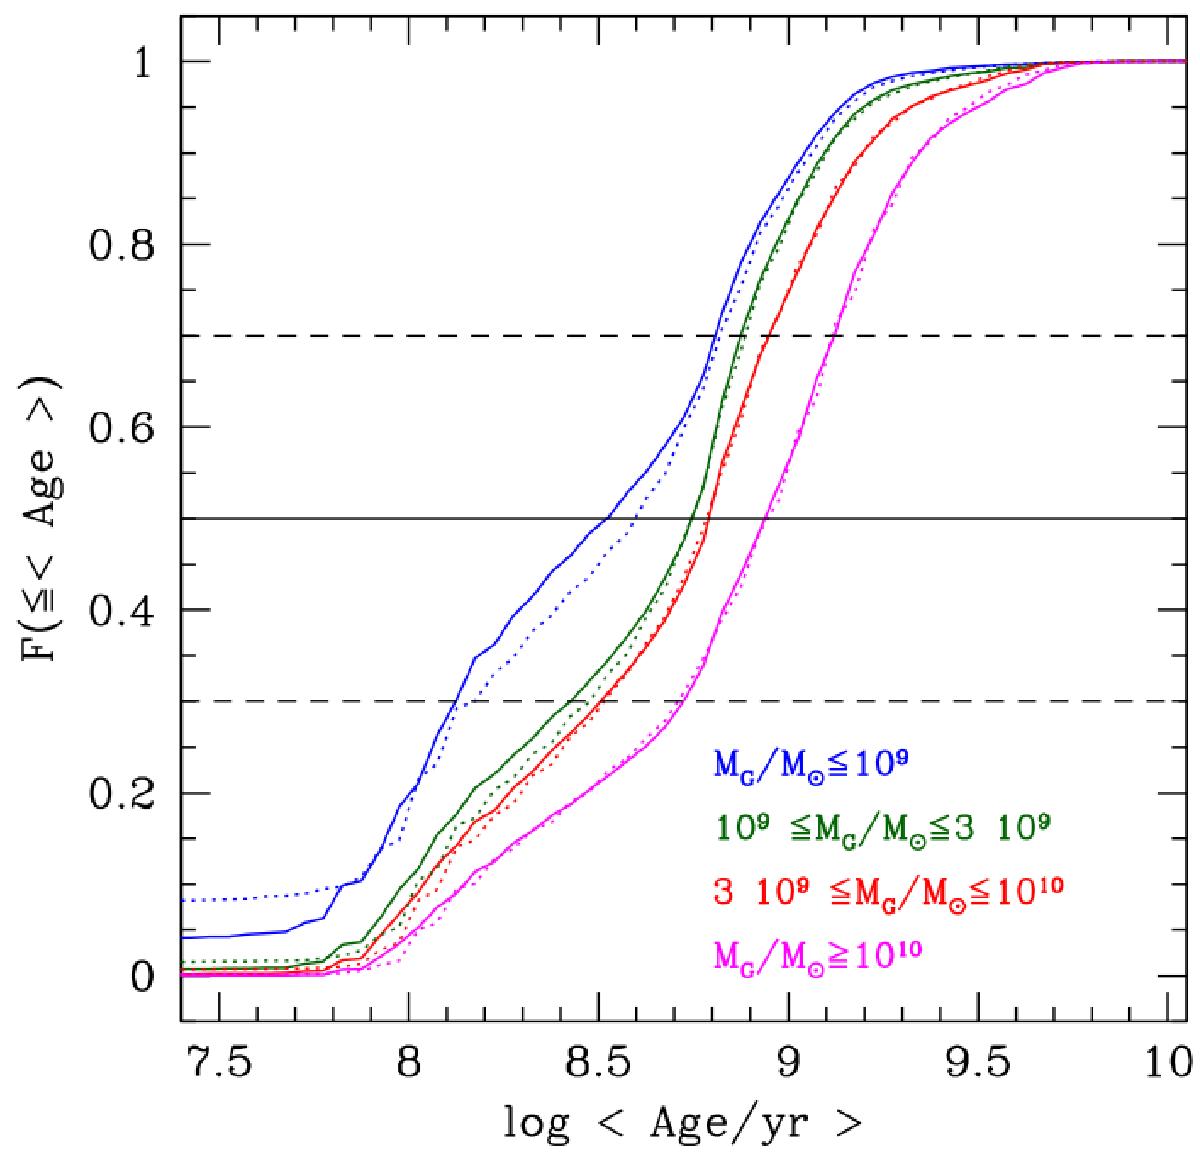
Cumulative distributions of the average mass-weighted age of star-forming galaxies, in four bins of galaxy mass as labelled. The solid lines show the average ages relative to fits with the exponentially declining SFH; the dotted lines refer instead to fits which adopt the delayed SFH. The horizontal lines intercept the curves at the median (solid) average age and at the 30th and 70th percentiles (dashed).
Current usage metrics show cumulative count of Article Views (full-text article views including HTML views, PDF and ePub downloads, according to the available data) and Abstracts Views on Vision4Press platform.
Data correspond to usage on the plateform after 2015. The current usage metrics is available 48-96 hours after online publication and is updated daily on week days.
Initial download of the metrics may take a while.