Fig. 13
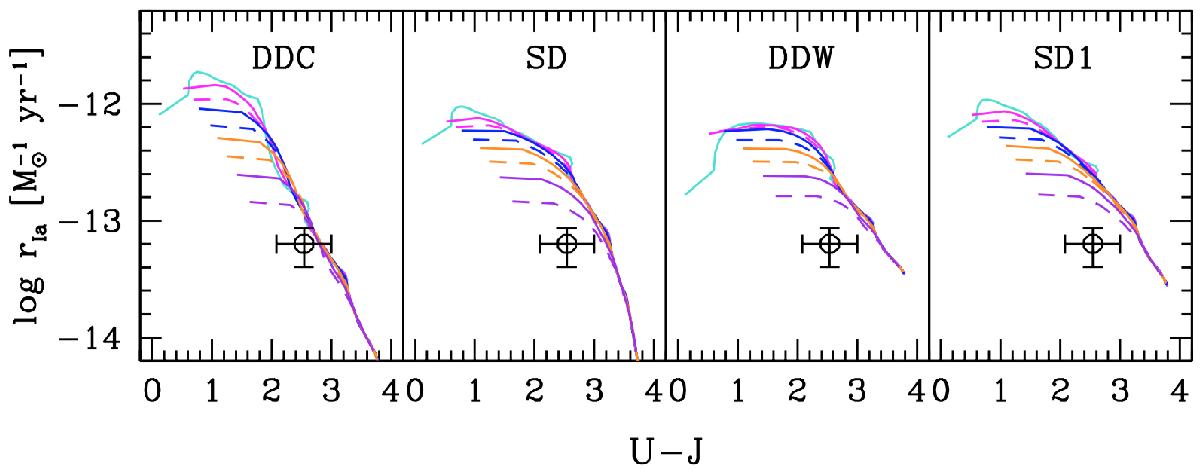
Models of the SN Ia rate per unit mass as a function of the U−J colour for passive galaxies, as described by the evolution past a burst of star formation. Each curve refers to different durations of the bursts, namely (0.1,0.5,0.8,1,1.5,2,3,4.5,8) Gyr (top to bottom). Different panels show the results for different DTD models as labelled, and adopt the values for kIa as in Fig. 12, namely ![]() . The circle shows the observational determination for the passive galaxies in our sample, and its error bar, as given in Table 4.
. The circle shows the observational determination for the passive galaxies in our sample, and its error bar, as given in Table 4.
Current usage metrics show cumulative count of Article Views (full-text article views including HTML views, PDF and ePub downloads, according to the available data) and Abstracts Views on Vision4Press platform.
Data correspond to usage on the plateform after 2015. The current usage metrics is available 48-96 hours after online publication and is updated daily on week days.
Initial download of the metrics may take a while.