Fig. 12
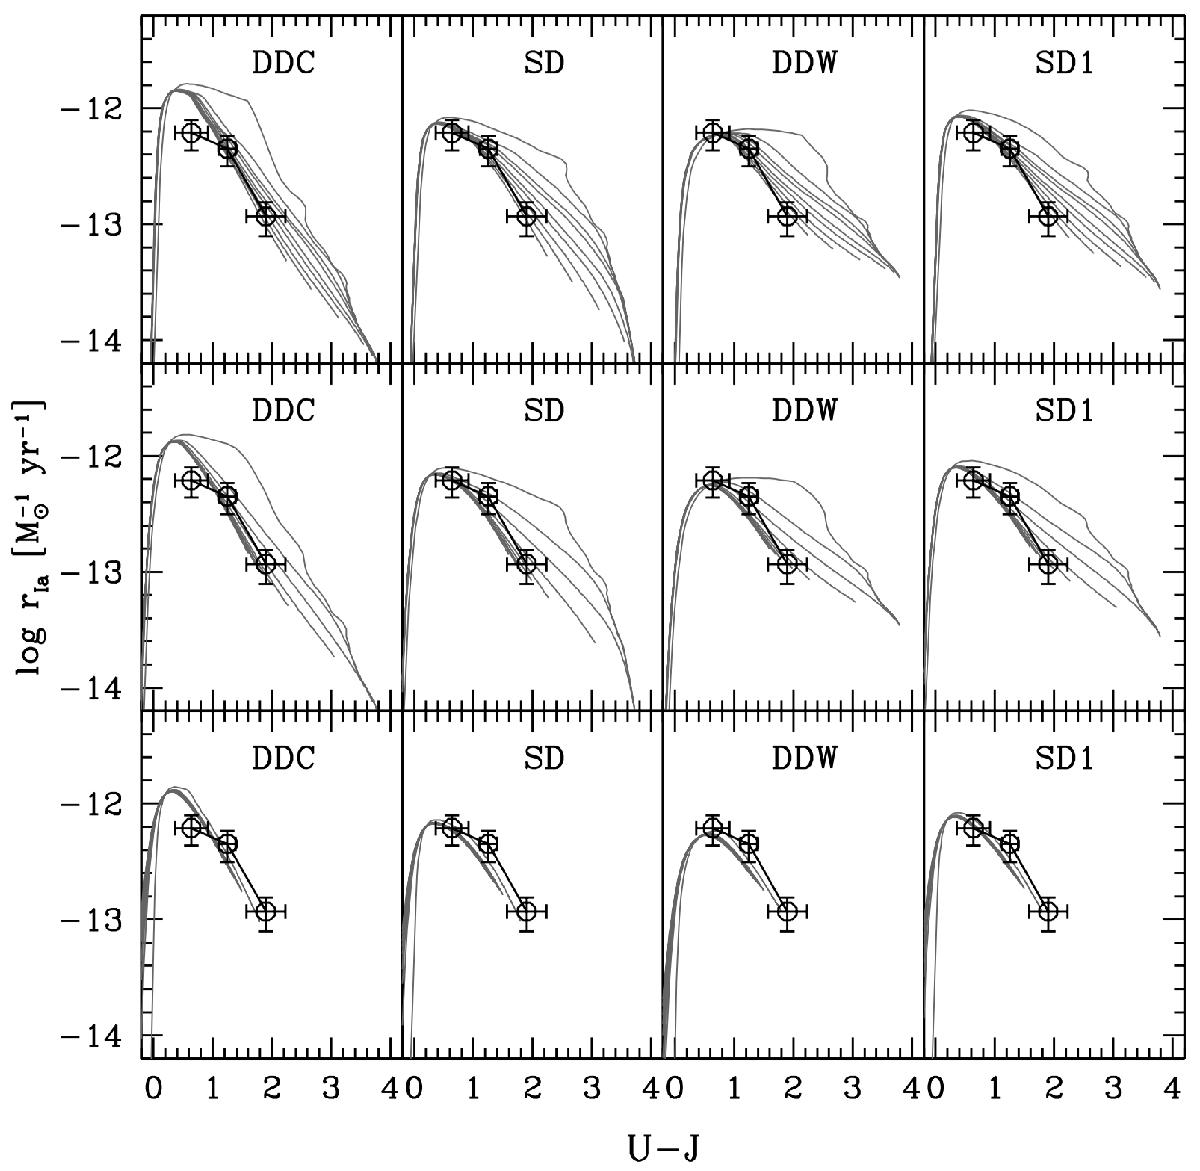
Models of the SN Ia rate per unit mass as a function of the U−J colour of composite stellar populations obtained with different kinds of SFH and the four DTDs shown in Fig. 11. Along each line the parameter AGE of the composite stellar population varies from 0.05 (bluest point in U−J) to 13 Gyr (reddest point in U−J). In the top panels the assumed SFH is an exponentially declining law with e-folding times of (8,4.5,3.0,2.0,1.5,1.0,0.8,0.5,0.1) Gyr (left to right). In the central panels the assumed SFH is a delayed exponential model peaked at (20,10,7.5,5,3.5,2.0,1.0,0.5,0.1) Gyr (left to right). In the bottom panels the adopted SFH is a power law ψ(t) ∝ t− p with p ranging from 0 to 2.8: all these models describe the same locus, and do not account for populations redder than U−J ~ 2. The adopted values of the productivity are different for the different DTDs, and equal to ![]() for the DDC, SD, DDW and SD1 model respectively. The circles show the observed rates, colours and error bars for star-forming galaxies reported in Table 4.
for the DDC, SD, DDW and SD1 model respectively. The circles show the observed rates, colours and error bars for star-forming galaxies reported in Table 4.
Current usage metrics show cumulative count of Article Views (full-text article views including HTML views, PDF and ePub downloads, according to the available data) and Abstracts Views on Vision4Press platform.
Data correspond to usage on the plateform after 2015. The current usage metrics is available 48-96 hours after online publication and is updated daily on week days.
Initial download of the metrics may take a while.