Fig. 10
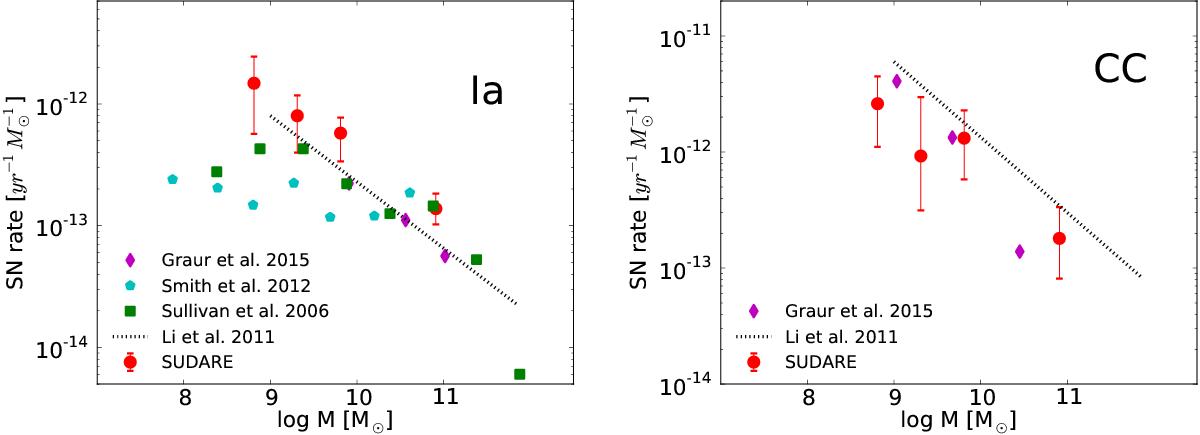
SN rates per unit stellar mass [10-3 SNe yr-1 10-10M⊙] as a function of the mass of the parent galaxy in the star-forming subsample for Type Ia (left panel) and CC SNe (right panel). In both panels the circles are from SUDARE, the triangles from Mannucci et al. (2005), the squares from Sullivan et al. (2006), the pentagons from Smith et al. (2012) and the diamonds from Graur et al. (2015). SN rates and masses have been rescaled to a Salpeter IMF.
Current usage metrics show cumulative count of Article Views (full-text article views including HTML views, PDF and ePub downloads, according to the available data) and Abstracts Views on Vision4Press platform.
Data correspond to usage on the plateform after 2015. The current usage metrics is available 48-96 hours after online publication and is updated daily on week days.
Initial download of the metrics may take a while.