Free Access
Fig. 3
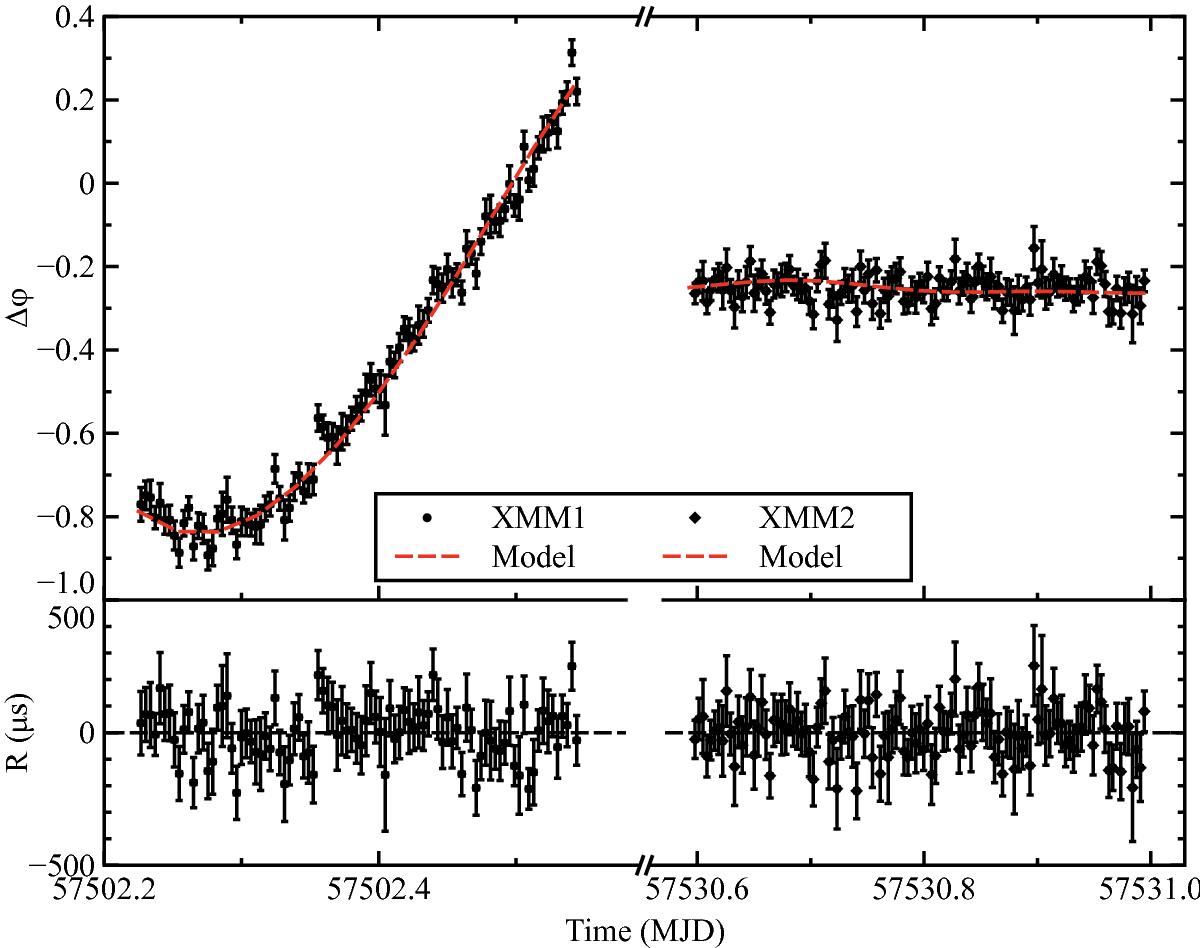
Top panel: pulse phase delays as a function of time computed by epoch-folding 300 s data intervals of the XMM-Newton observations, together with the best-fit model (red dotted line, see text). Bottom panel: residuals in μs with respect to the best-fitting orbital solution.
Current usage metrics show cumulative count of Article Views (full-text article views including HTML views, PDF and ePub downloads, according to the available data) and Abstracts Views on Vision4Press platform.
Data correspond to usage on the plateform after 2015. The current usage metrics is available 48-96 hours after online publication and is updated daily on week days.
Initial download of the metrics may take a while.