Fig. 12
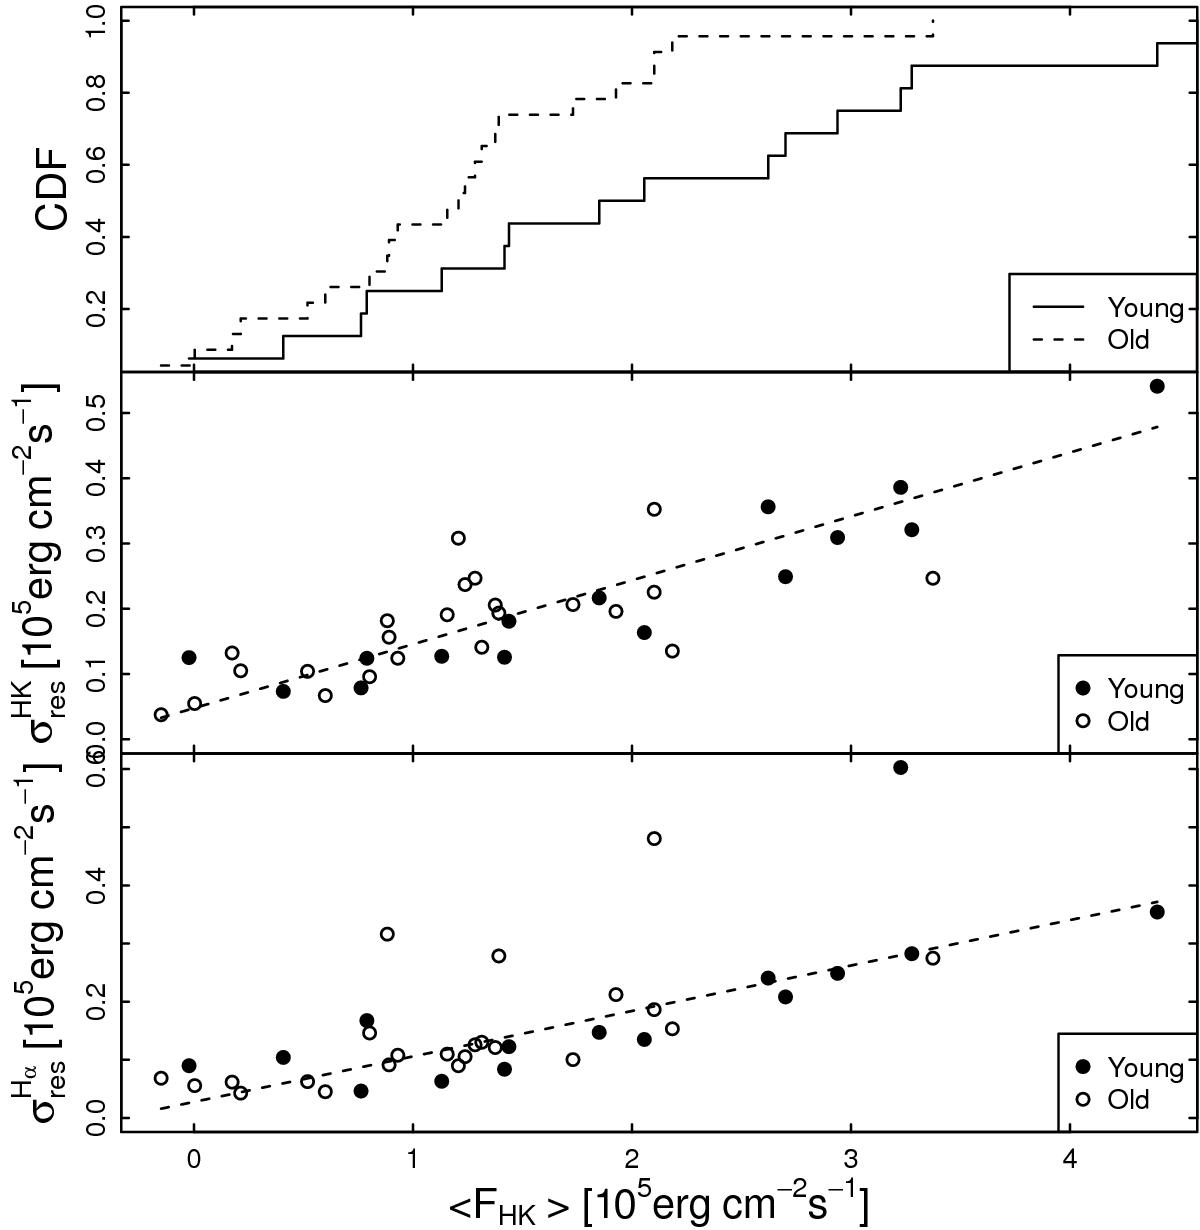
Top panel: empirical cumulative distribution function of the ⟨ FHK ⟩ measurement for young (solid line) and old (dashed line) stars, following the classification of Maldonado et al. (2017) based on kinematics. Central panel: standard deviation ![]() of the H&K measurements corrected for the quadratic trend (Sect. 4.2) as a function of the average level of activity ⟨ FHK ⟩. The black dashes represent the best-fit line; the best-fit coefficients are given in Table 2. Filled and open circles mark young and old stars, respectively. Bottom panel: same as in the middle panel, but for the residual Hα line.
of the H&K measurements corrected for the quadratic trend (Sect. 4.2) as a function of the average level of activity ⟨ FHK ⟩. The black dashes represent the best-fit line; the best-fit coefficients are given in Table 2. Filled and open circles mark young and old stars, respectively. Bottom panel: same as in the middle panel, but for the residual Hα line.
Current usage metrics show cumulative count of Article Views (full-text article views including HTML views, PDF and ePub downloads, according to the available data) and Abstracts Views on Vision4Press platform.
Data correspond to usage on the plateform after 2015. The current usage metrics is available 48-96 hours after online publication and is updated daily on week days.
Initial download of the metrics may take a while.