Fig. 1
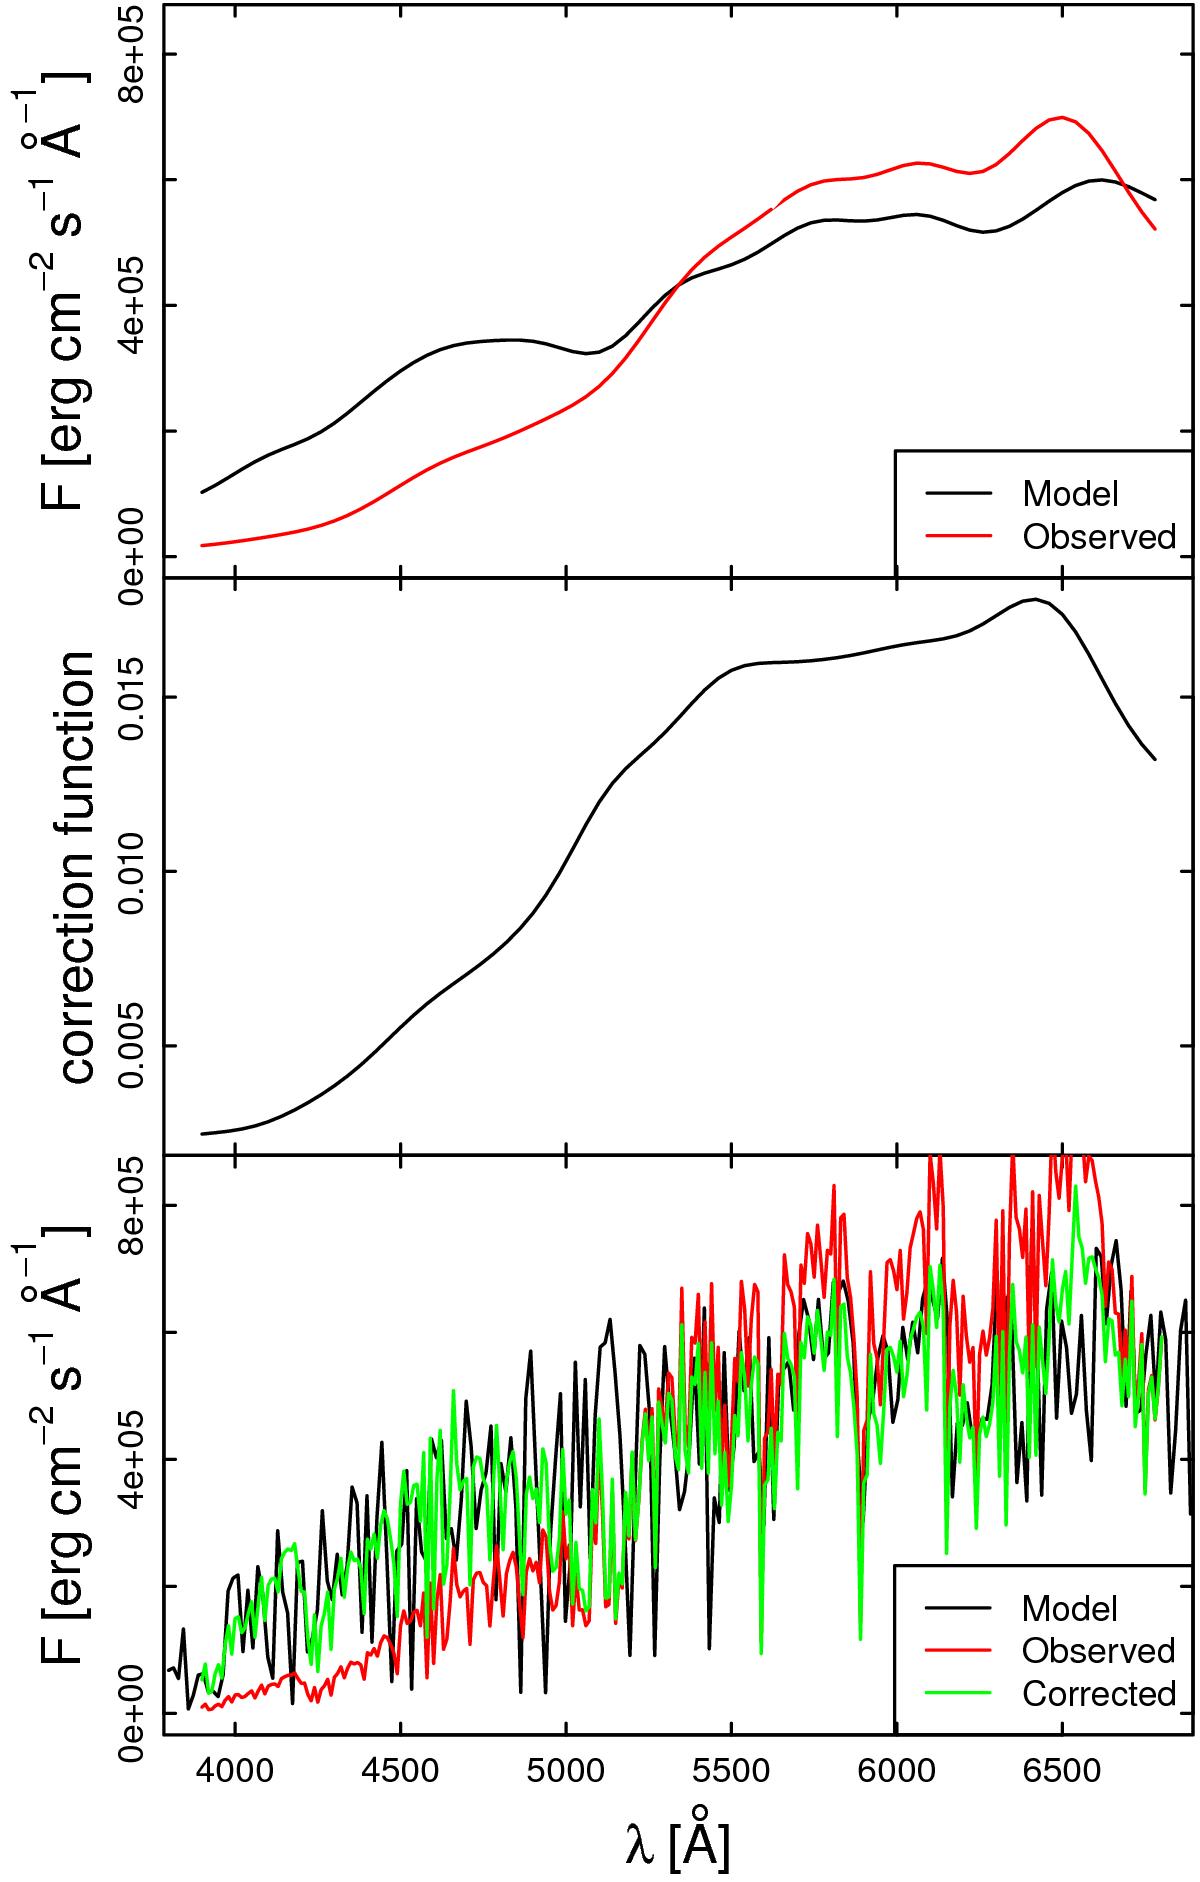
Example of the correction of the observed spectra discussed in the text. Top panel: comparison between the BT-Settl model spectrum (in black) and the observed spectrum (in red), both degraded to low resolution. For plotting reasons, the observed spectrum, still in instrumental units, is rescaled to approximately match the flux scale of the model spectrum. Middle panel: observed-to-model ratio correction. The curve describes the rescaling of the observed spectrum into absolute units. Bottom panel: result of the rescaling: the high-resolution spectra corresponding to those shown in the top panel are plotted in black and red again. The green line shows the corrected high-resolution spectrum.
Current usage metrics show cumulative count of Article Views (full-text article views including HTML views, PDF and ePub downloads, according to the available data) and Abstracts Views on Vision4Press platform.
Data correspond to usage on the plateform after 2015. The current usage metrics is available 48-96 hours after online publication and is updated daily on week days.
Initial download of the metrics may take a while.