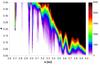
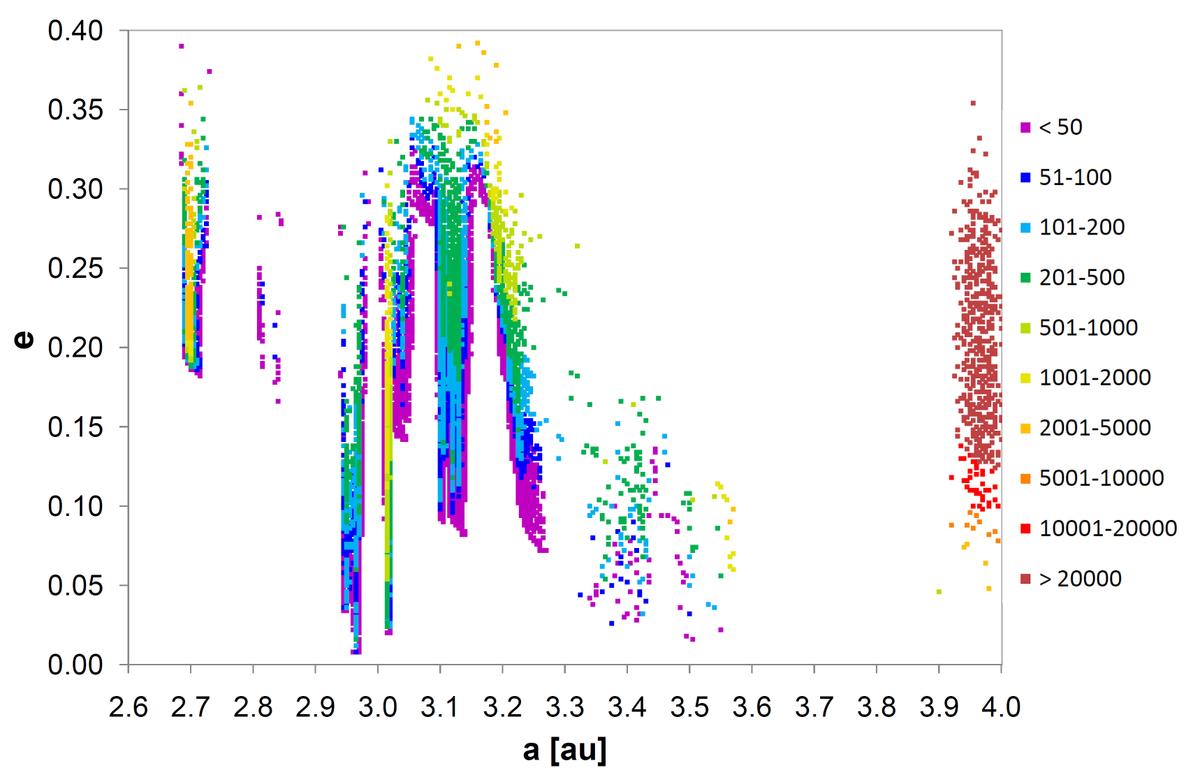
Fig. 13
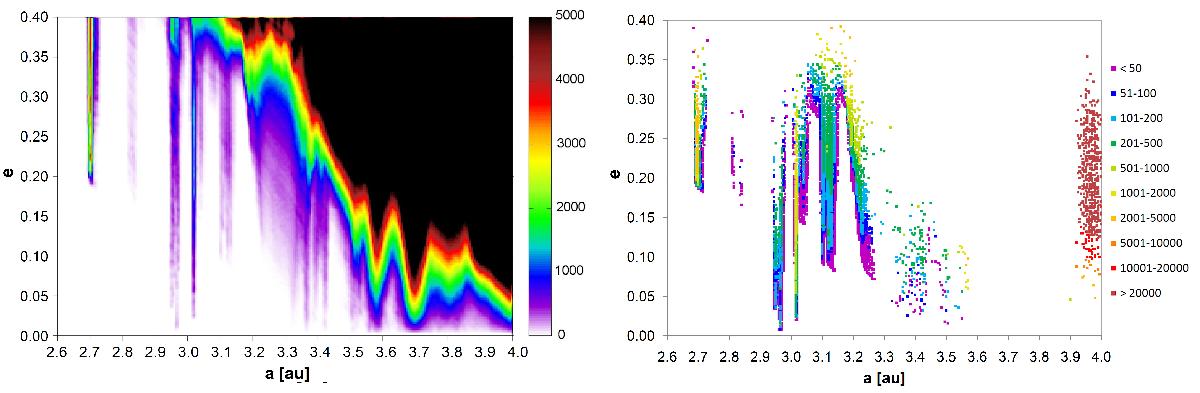
Left-hand panel: number of revolutions spent by our sample comets per unit area in the asteroidal parts of the (a,e) plane, plotted according to an arbitrary colour scale shown on the right. Right-hand panel: same area of the (a,e) plane, cut into small cells for which the total number of comet orbital revolutions within the cell, as listed, is plotted using the colour scale shown on the right. Only cells occupied by at least two asteroids in the MPC database are plotted.
Current usage metrics show cumulative count of Article Views (full-text article views including HTML views, PDF and ePub downloads, according to the available data) and Abstracts Views on Vision4Press platform.
Data correspond to usage on the plateform after 2015. The current usage metrics is available 48-96 hours after online publication and is updated daily on week days.
Initial download of the metrics may take a while.