Free Access
Fig. 4
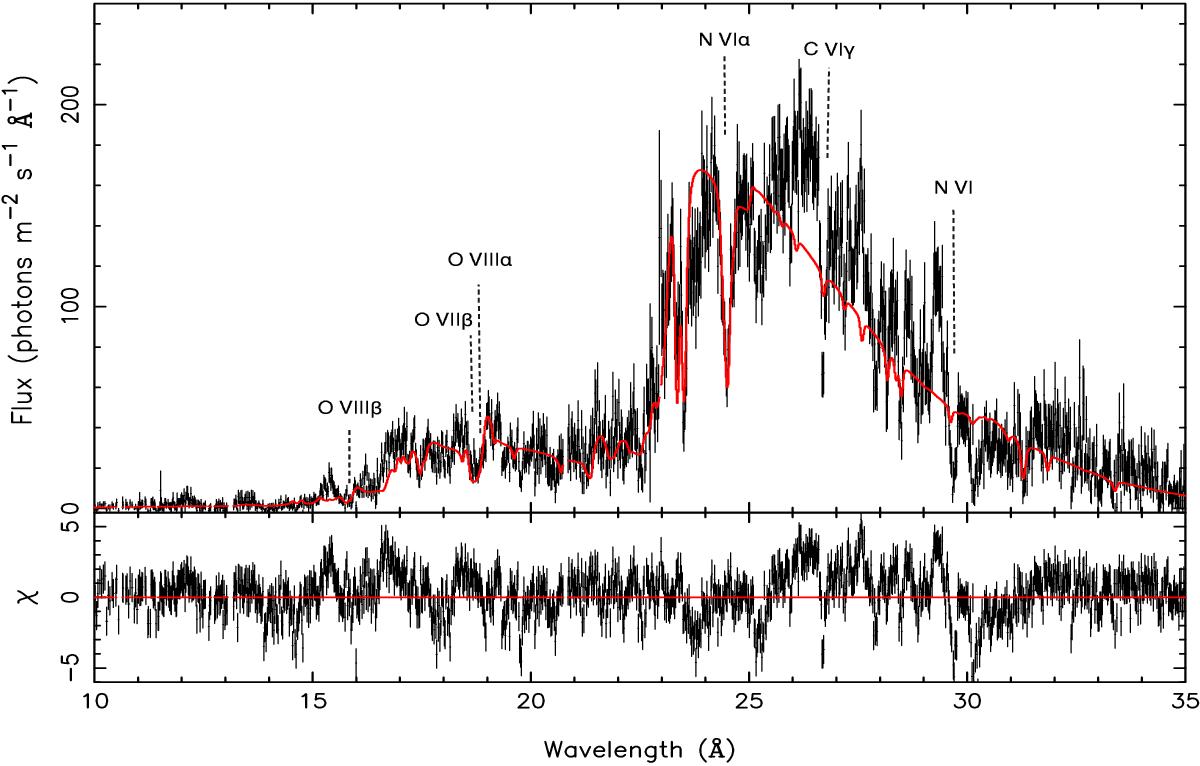
RGS1+2 fluxed spectrum of V2491 Cyg using region 2 of the LC (first observation) fitted with the composite model described in the text using the Hot model in SPEX (see Table 1). Certain detected blueshifted absorption lines are labeled with dashed lines.
Current usage metrics show cumulative count of Article Views (full-text article views including HTML views, PDF and ePub downloads, according to the available data) and Abstracts Views on Vision4Press platform.
Data correspond to usage on the plateform after 2015. The current usage metrics is available 48-96 hours after online publication and is updated daily on week days.
Initial download of the metrics may take a while.