Fig. 9
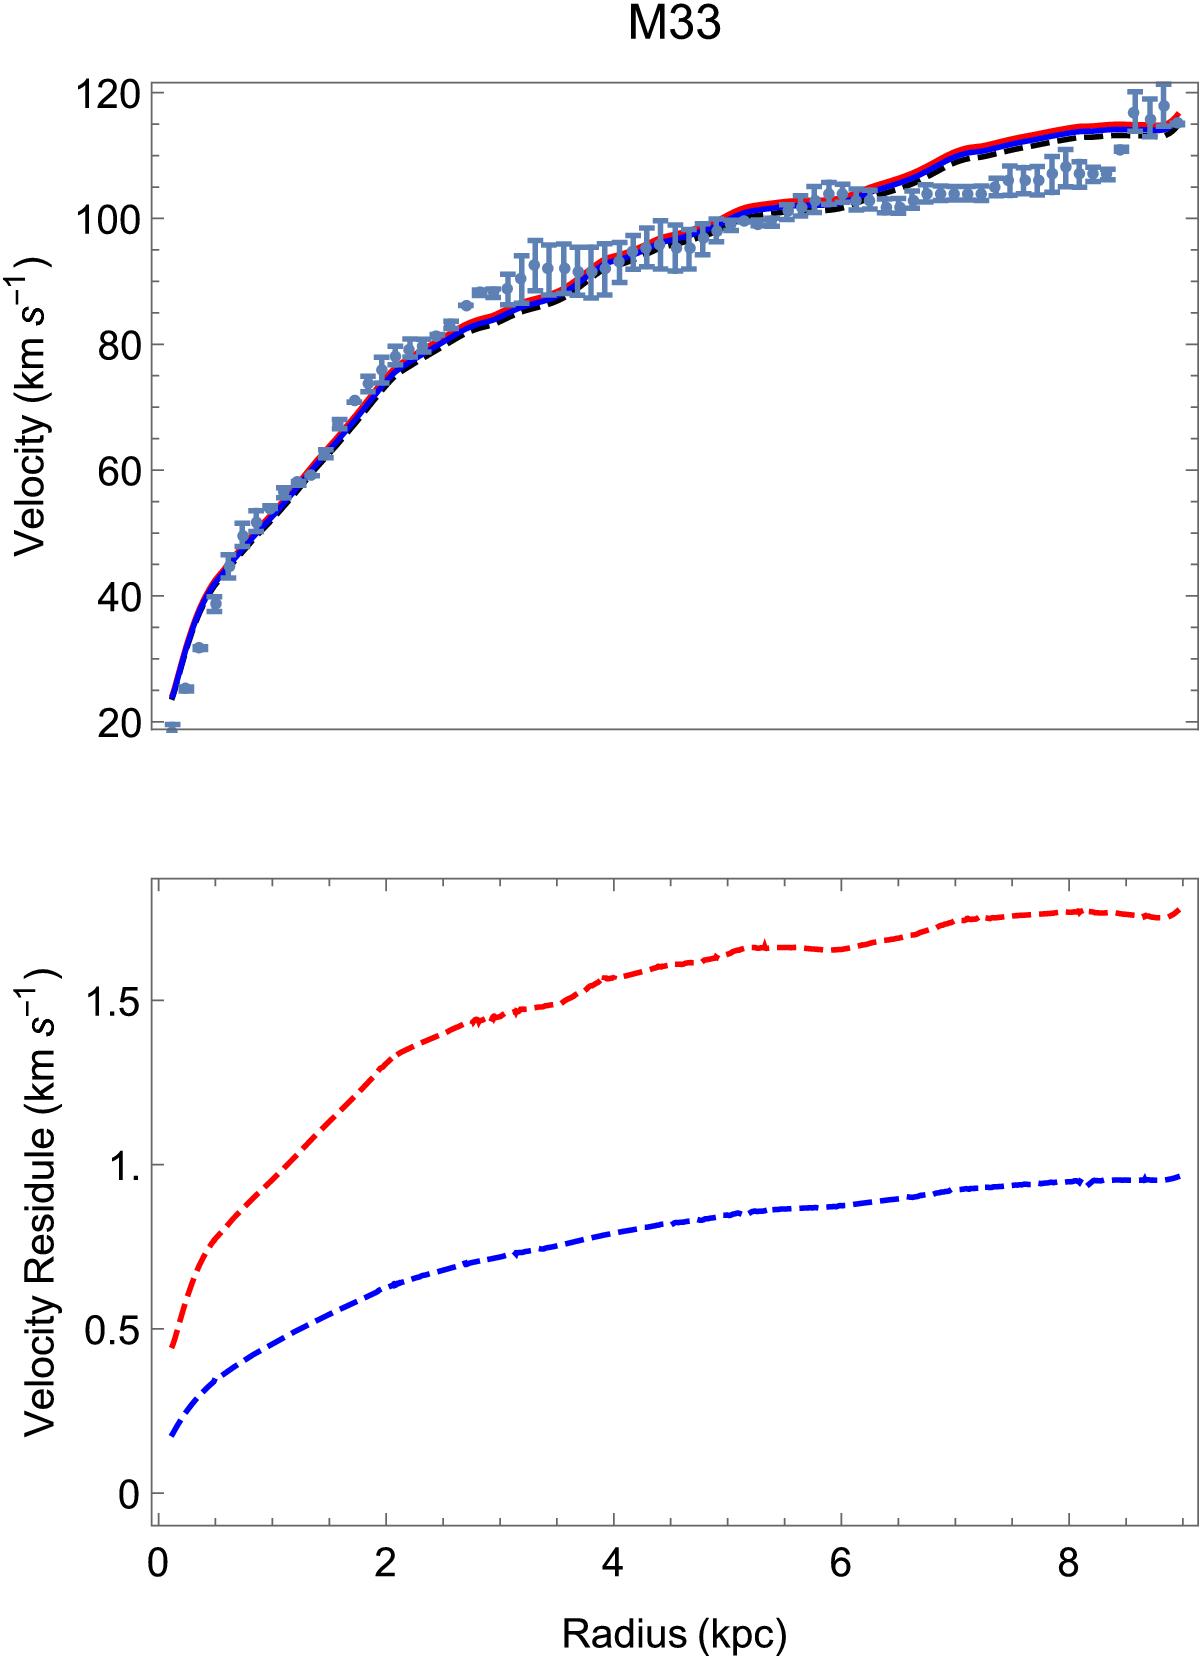
Top: rotation curve of M33. Blue points are the data with error bars, the black dashed line is the regular MOND fit, the red line is the new relation, and the blue line is EMOND. Bottom: residual between MOND, the new relation, and EMOND. Note the difference between these rotation curves are actually tiny (~1 km s-1). Here we adopted a background potential of 10-6c2 given in Zhao & Famaey (2012), and a stellar mass to light of 0.722.
Current usage metrics show cumulative count of Article Views (full-text article views including HTML views, PDF and ePub downloads, according to the available data) and Abstracts Views on Vision4Press platform.
Data correspond to usage on the plateform after 2015. The current usage metrics is available 48-96 hours after online publication and is updated daily on week days.
Initial download of the metrics may take a while.