Fig. 7
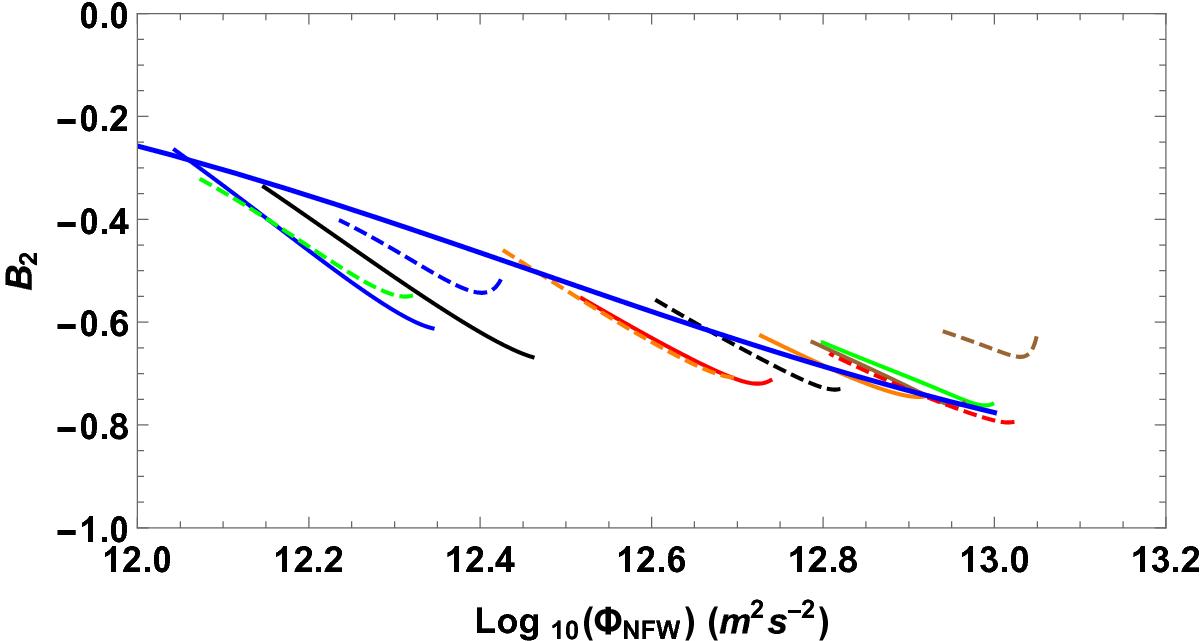
Value B2 (Eq. (26)) as a function of NFW gravitational potential for each cluster (thin lines). We overplot a thin blue line that shows μ(Φ/Φ0) for Φ0 = −1 700 0002 m2 s-2. Note all clusters lie fairly close to this line, with some discrepancy due to our adopted NFW profile not representing the total potential. This B2 correction to MOND allows the MOND interpolation function to run with the potential as well as the acceleration.
Current usage metrics show cumulative count of Article Views (full-text article views including HTML views, PDF and ePub downloads, according to the available data) and Abstracts Views on Vision4Press platform.
Data correspond to usage on the plateform after 2015. The current usage metrics is available 48-96 hours after online publication and is updated daily on week days.
Initial download of the metrics may take a while.