Fig. 5
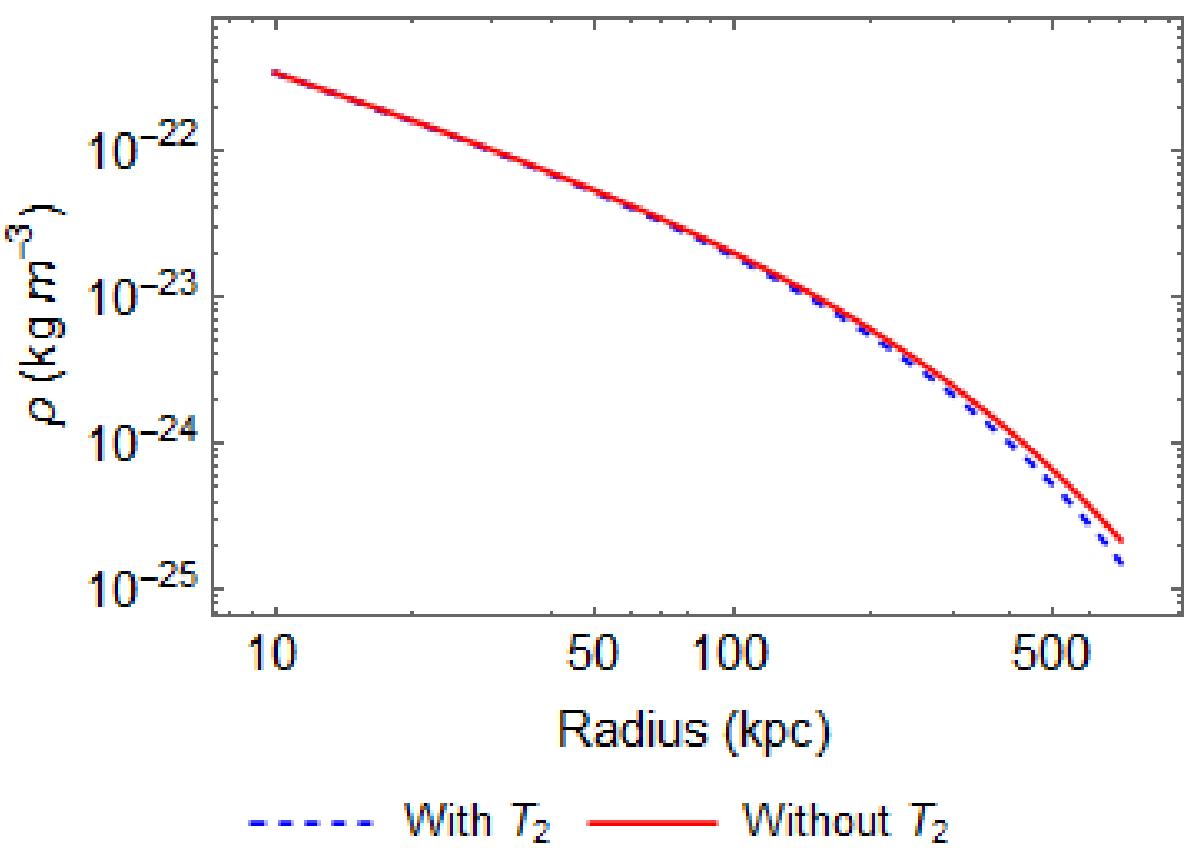
Calculated density, predicted by EMOND for cluster A133. Blue dashed line shows the density with the inclusion of the T2 term (Eq. (5)) and red line shows the density calculated from approximate Poisson equation (Eq. (7)). The lines are almost identical showing the T2 term was indeed justifiably neglected. Note that the small differences in the outer regions of the cluster is an artifact because the asymptotic potential of NFW is compatible mathematically with EMOND only if the latter also allows the density dipping into negative at large radii.
Current usage metrics show cumulative count of Article Views (full-text article views including HTML views, PDF and ePub downloads, according to the available data) and Abstracts Views on Vision4Press platform.
Data correspond to usage on the plateform after 2015. The current usage metrics is available 48-96 hours after online publication and is updated daily on week days.
Initial download of the metrics may take a while.