Free Access
Fig. 11
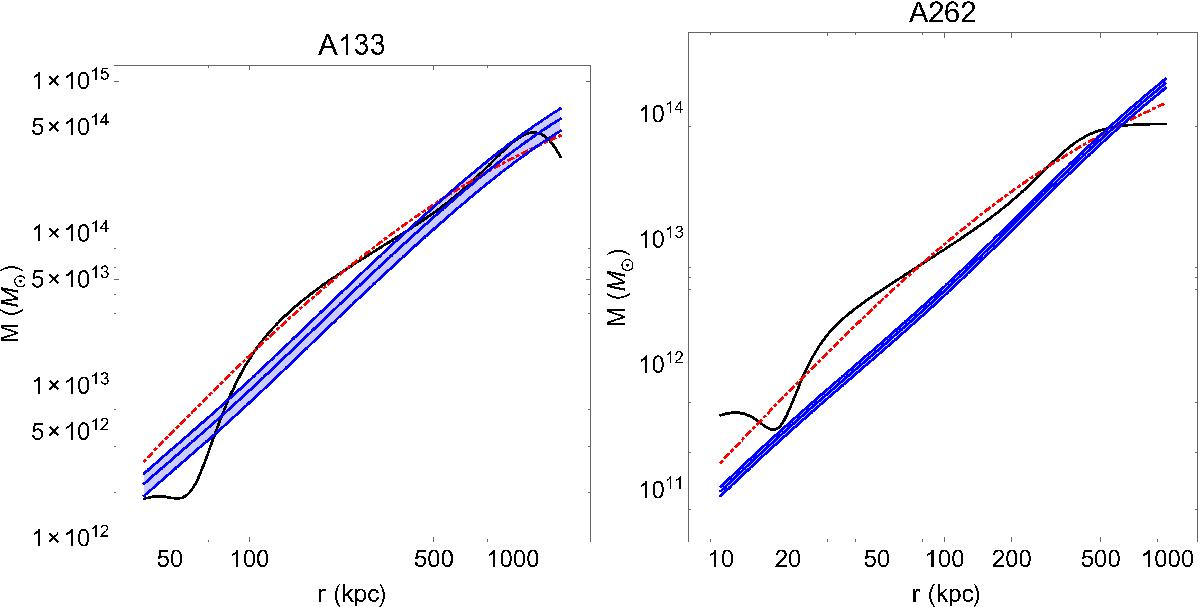
Mass profiles for the new relation for different values for the boundary potential (blue shaded region). Also the plot shows the NFW (red dotted line) and dynamical masses (black solid line) for clusters A133 and A262.
This figure is made of several images, please see below:
Current usage metrics show cumulative count of Article Views (full-text article views including HTML views, PDF and ePub downloads, according to the available data) and Abstracts Views on Vision4Press platform.
Data correspond to usage on the plateform after 2015. The current usage metrics is available 48-96 hours after online publication and is updated daily on week days.
Initial download of the metrics may take a while.