Fig. 3
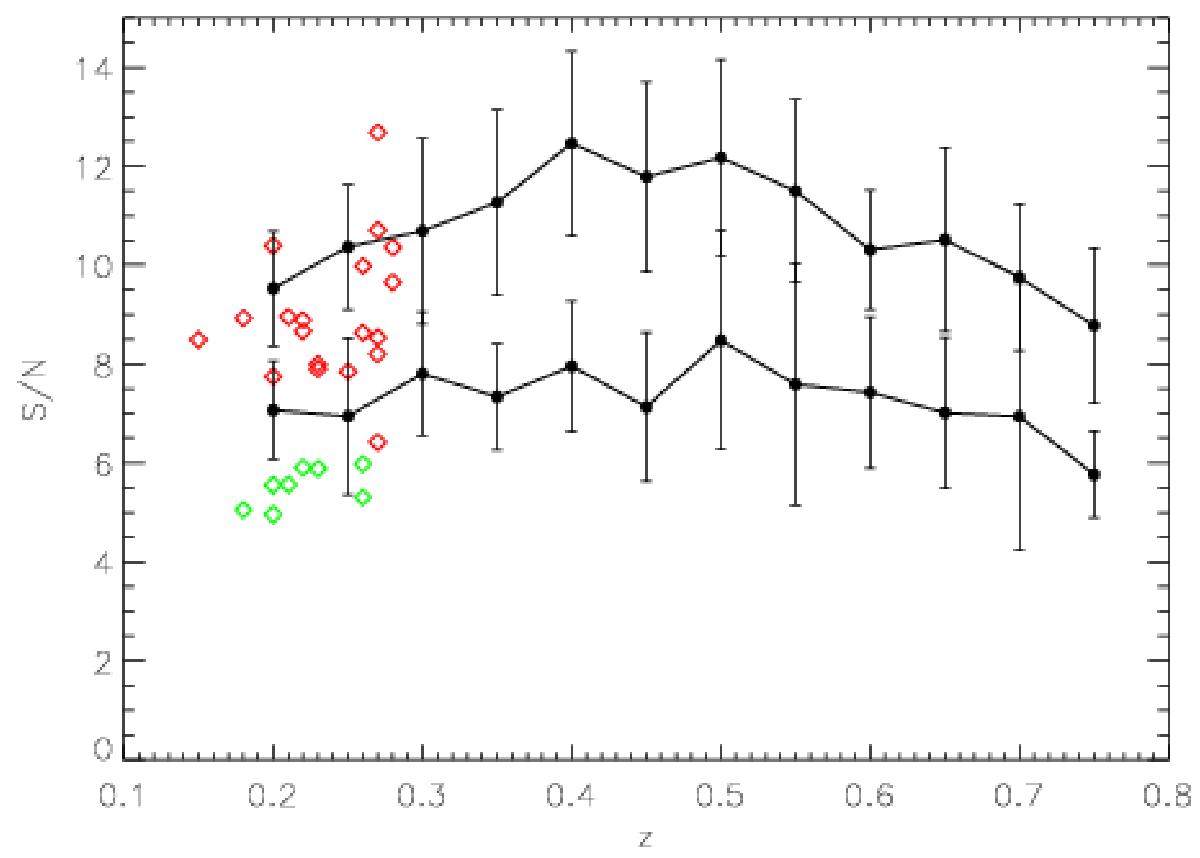
Average signal-to-noise ratio for our mock clusters as a function of redshift, computed separately for the sample of halos originally detected in the real KiDS data with S/N > 6 and S/N < 6 (red and green points, respectively). For each sample, black lines show the average S/N of the detected mock halos at a given redshift, while error bars indicate the rms.
Current usage metrics show cumulative count of Article Views (full-text article views including HTML views, PDF and ePub downloads, according to the available data) and Abstracts Views on Vision4Press platform.
Data correspond to usage on the plateform after 2015. The current usage metrics is available 48-96 hours after online publication and is updated daily on week days.
Initial download of the metrics may take a while.