Free Access
Fig. A.1
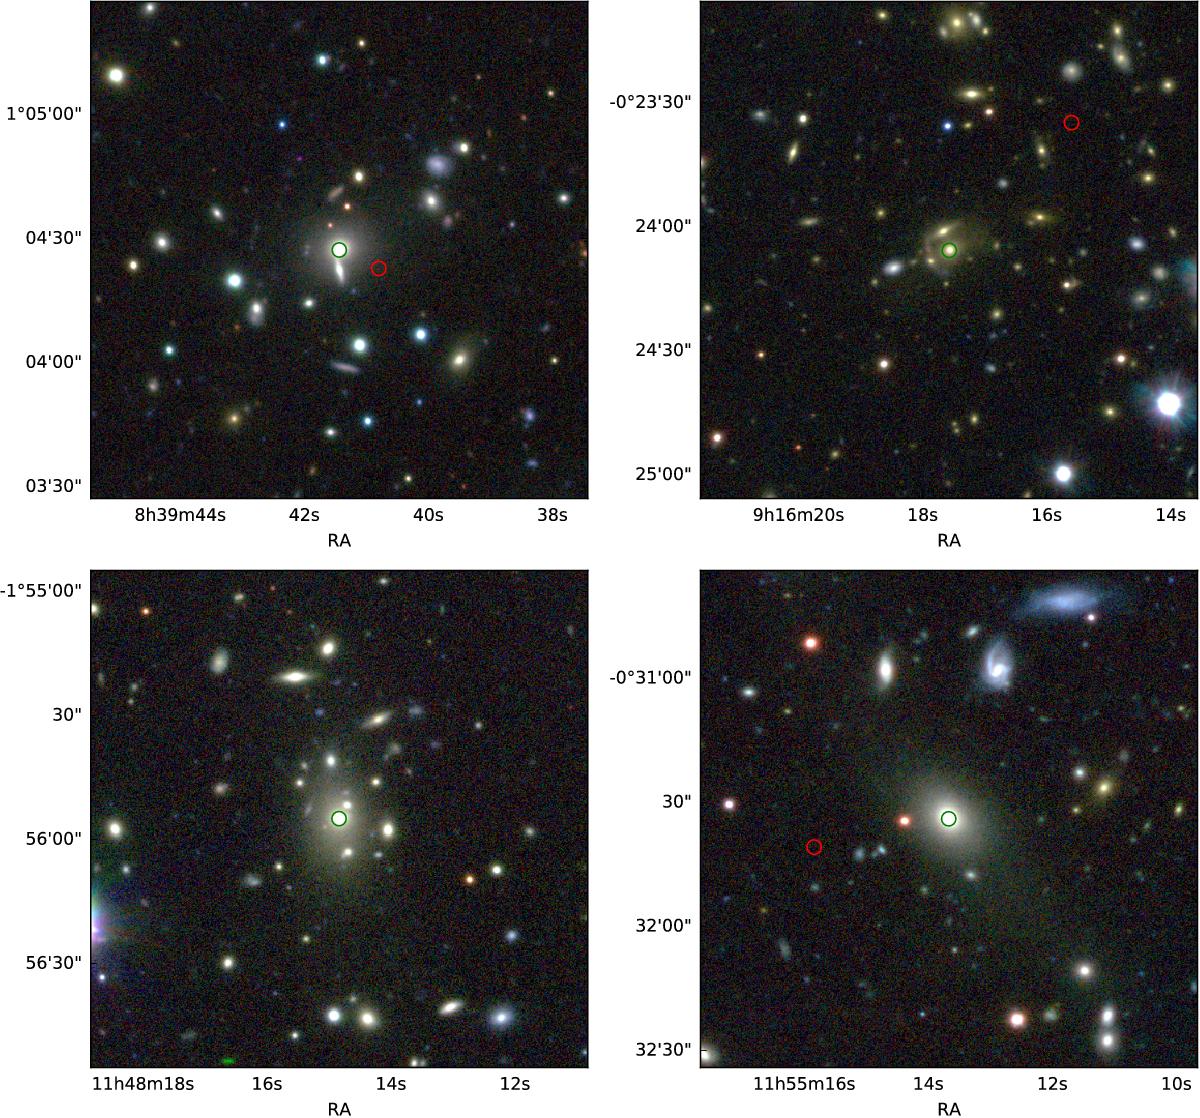
KiDS ugr images of the inner 2′ regions for the Abell clusters A693, A776, A1386 and A1411 (from upper-left clockwise). Green circles show the position of the BCG; the cluster centers in the Abell catalog are displayed by the red circles, if within the region.
Current usage metrics show cumulative count of Article Views (full-text article views including HTML views, PDF and ePub downloads, according to the available data) and Abstracts Views on Vision4Press platform.
Data correspond to usage on the plateform after 2015. The current usage metrics is available 48-96 hours after online publication and is updated daily on week days.
Initial download of the metrics may take a while.