Fig. 2
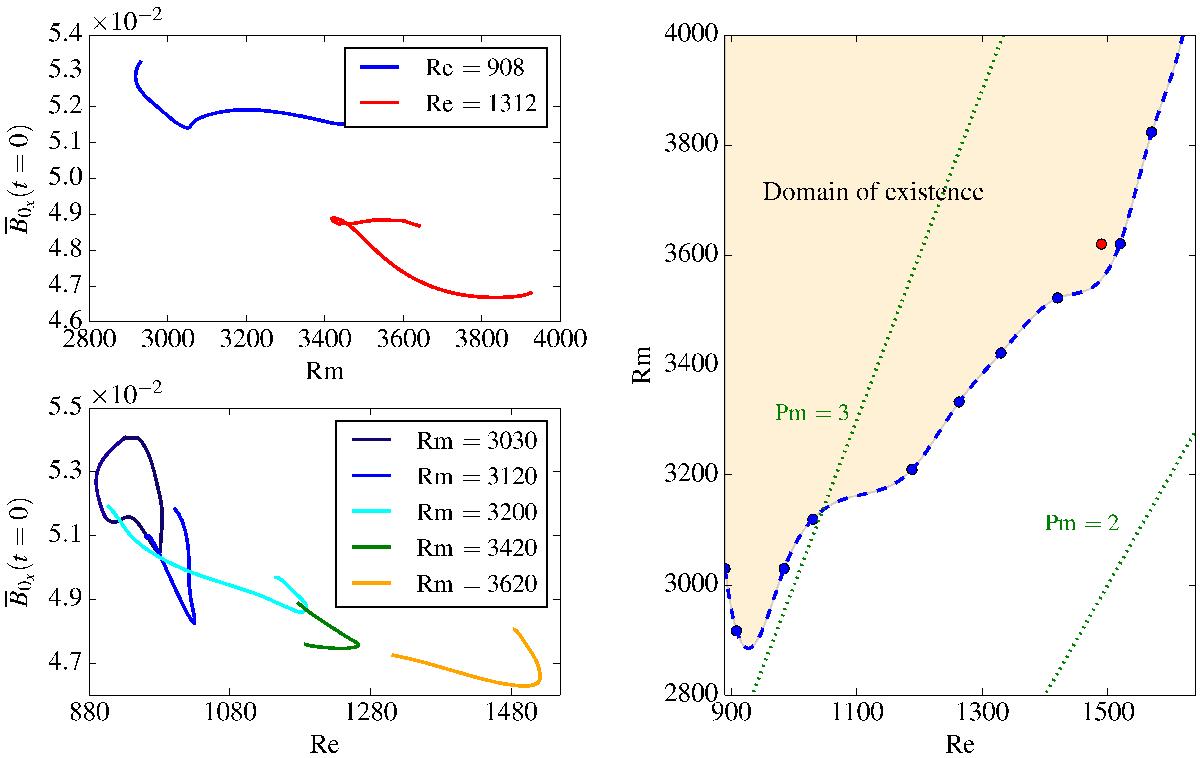
Left, top panel: selected continuation curves in Rm of SN2m at fixed Re; bottom panel: selected continuation curves in Re at fixed Rm. Right: existence boundary of SN2m in the (Re, Rm) plane (blue/dashed line) obtained by interpolating the different saddle node points Rmc(Re) and Rec(Rm) (blue bullets). The orange area shows the domain of existence of SN2m in parameter space. The red bullet shows a saddle note bifurcation point computed at double resolution (96 × 96 × 144).
Current usage metrics show cumulative count of Article Views (full-text article views including HTML views, PDF and ePub downloads, according to the available data) and Abstracts Views on Vision4Press platform.
Data correspond to usage on the plateform after 2015. The current usage metrics is available 48-96 hours after online publication and is updated daily on week days.
Initial download of the metrics may take a while.