Fig. 9
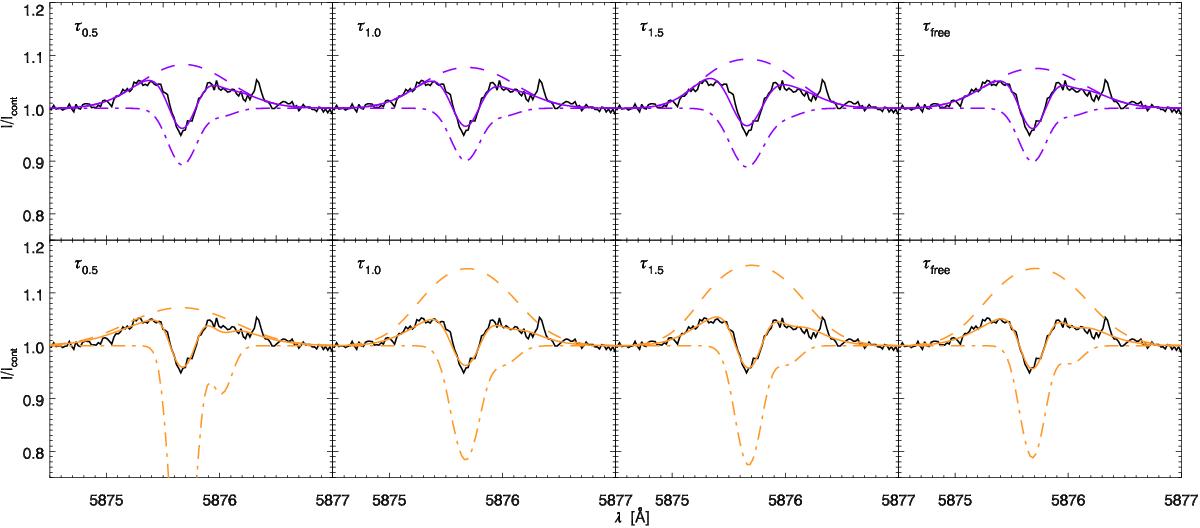
Upper row (purple): fits obtained using two stacked slabs. Lower row (orange): fits obtained using a filling factor. The total fit is shown in colour in a solid line. In every panel, we show the same observed EB3 profile in a black solid line. The emission component (dashed line) and the absorption component (dash-dot line) are overplotted. The τ label indicates whether τ1 has been fixed to a certain value, or it has been free to vary in the inversion, see Table 3.
Current usage metrics show cumulative count of Article Views (full-text article views including HTML views, PDF and ePub downloads, according to the available data) and Abstracts Views on Vision4Press platform.
Data correspond to usage on the plateform after 2015. The current usage metrics is available 48-96 hours after online publication and is updated daily on week days.
Initial download of the metrics may take a while.