Fig. 6
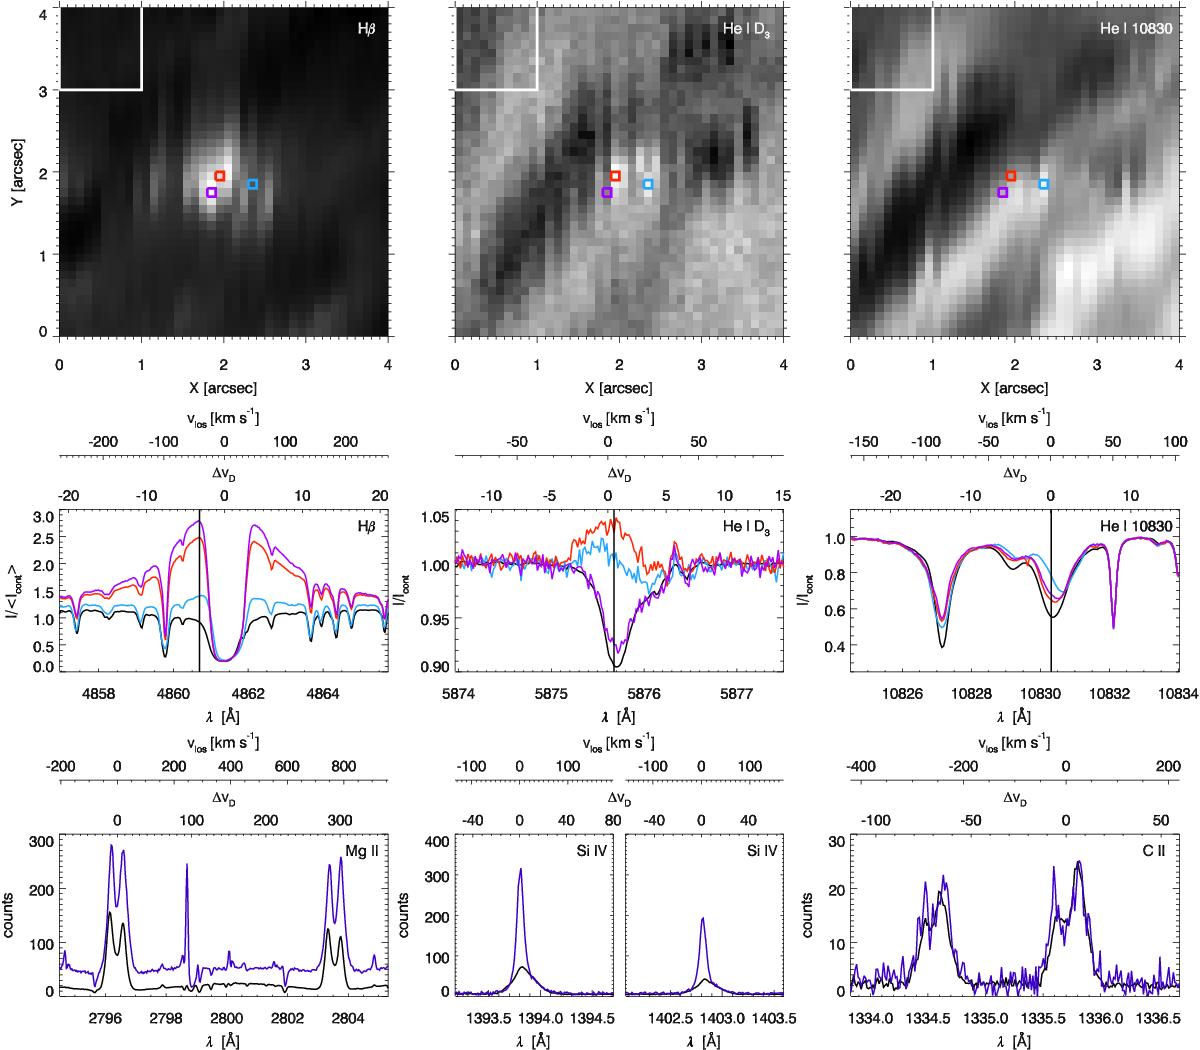
Spectra and raster scan images of EB1. The upper three panels represent raster scan images for respectively Hβ, He i D3, and He i 10 830 Å. The exact wavelength at which the raster scan images are shown is indicated by a black vertical line on the corresponding spectra. The white box indicates the region for which the average spectrum is given in black. The coloured boxes around certain pixels correspond to the pixels for which the spectra are given in the same colour. All spectra are given on three scales: wavelength λ, Doppler width ΔvD and line-of-sight (LOS) velocity vLOS.
Current usage metrics show cumulative count of Article Views (full-text article views including HTML views, PDF and ePub downloads, according to the available data) and Abstracts Views on Vision4Press platform.
Data correspond to usage on the plateform after 2015. The current usage metrics is available 48-96 hours after online publication and is updated daily on week days.
Initial download of the metrics may take a while.