Fig. 3
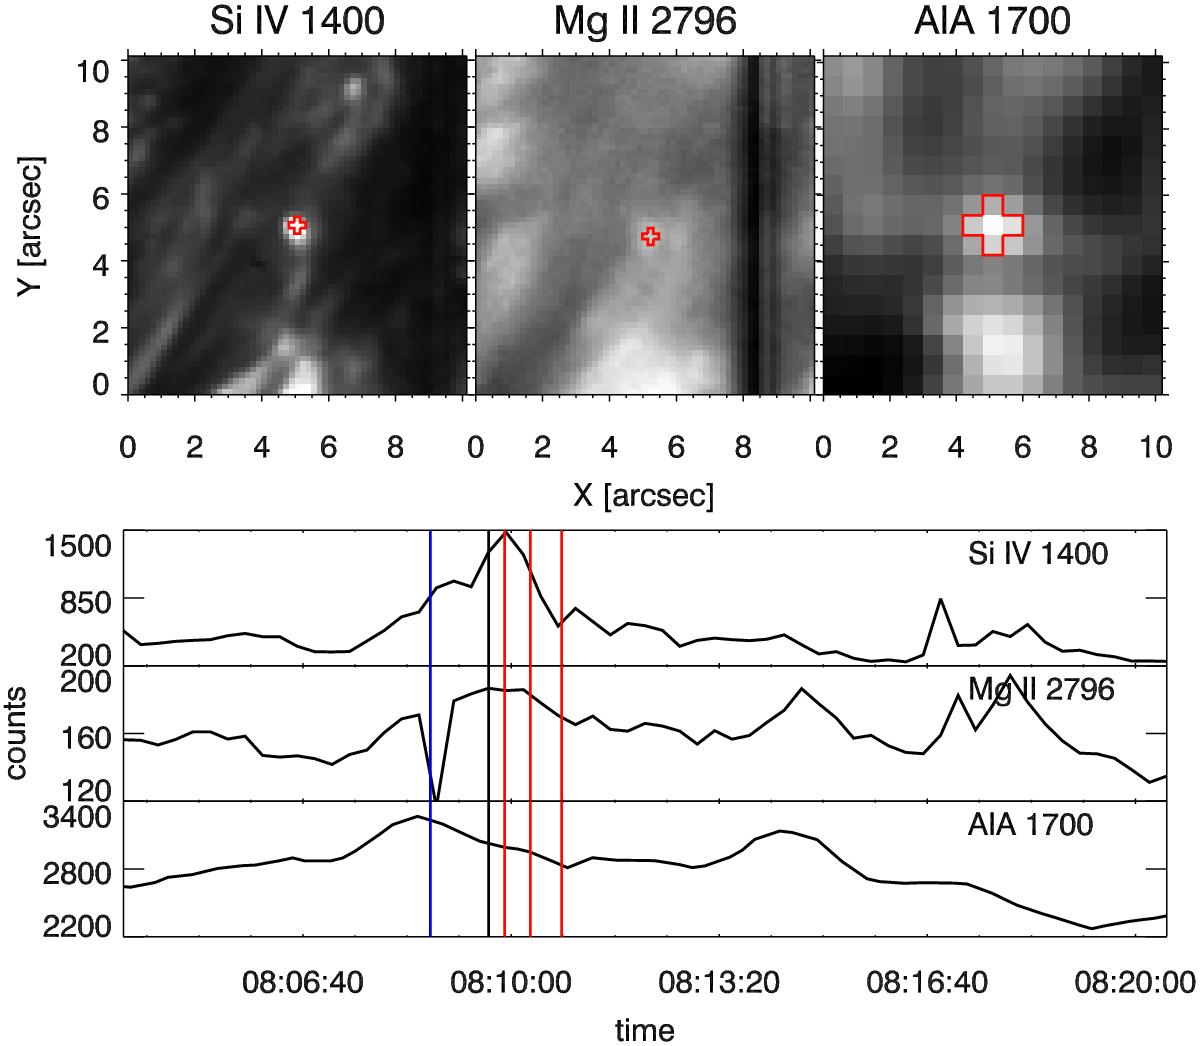
Light curves for EB1. The upper three panels show IRIS and SDO/AIA images of the EB. The red cross indicates the pixels used to calculate the corresponding light curves shown in the lower three panels. The vertical blue line overplotted on the light curve indicates the time where the IRIS slit was scanning the EB. The vertical black line indicates the time at which the images in the upper three panels are shown. The three vertical red lines show the times of the SST slit scanning the EB in Hβ (left), He i D3 (middle) and He i 10 830 Å (right). The time difference is due to differential atmospheric refraction. (Online movie.)
Current usage metrics show cumulative count of Article Views (full-text article views including HTML views, PDF and ePub downloads, according to the available data) and Abstracts Views on Vision4Press platform.
Data correspond to usage on the plateform after 2015. The current usage metrics is available 48-96 hours after online publication and is updated daily on week days.
Initial download of the metrics may take a while.