Fig. 2
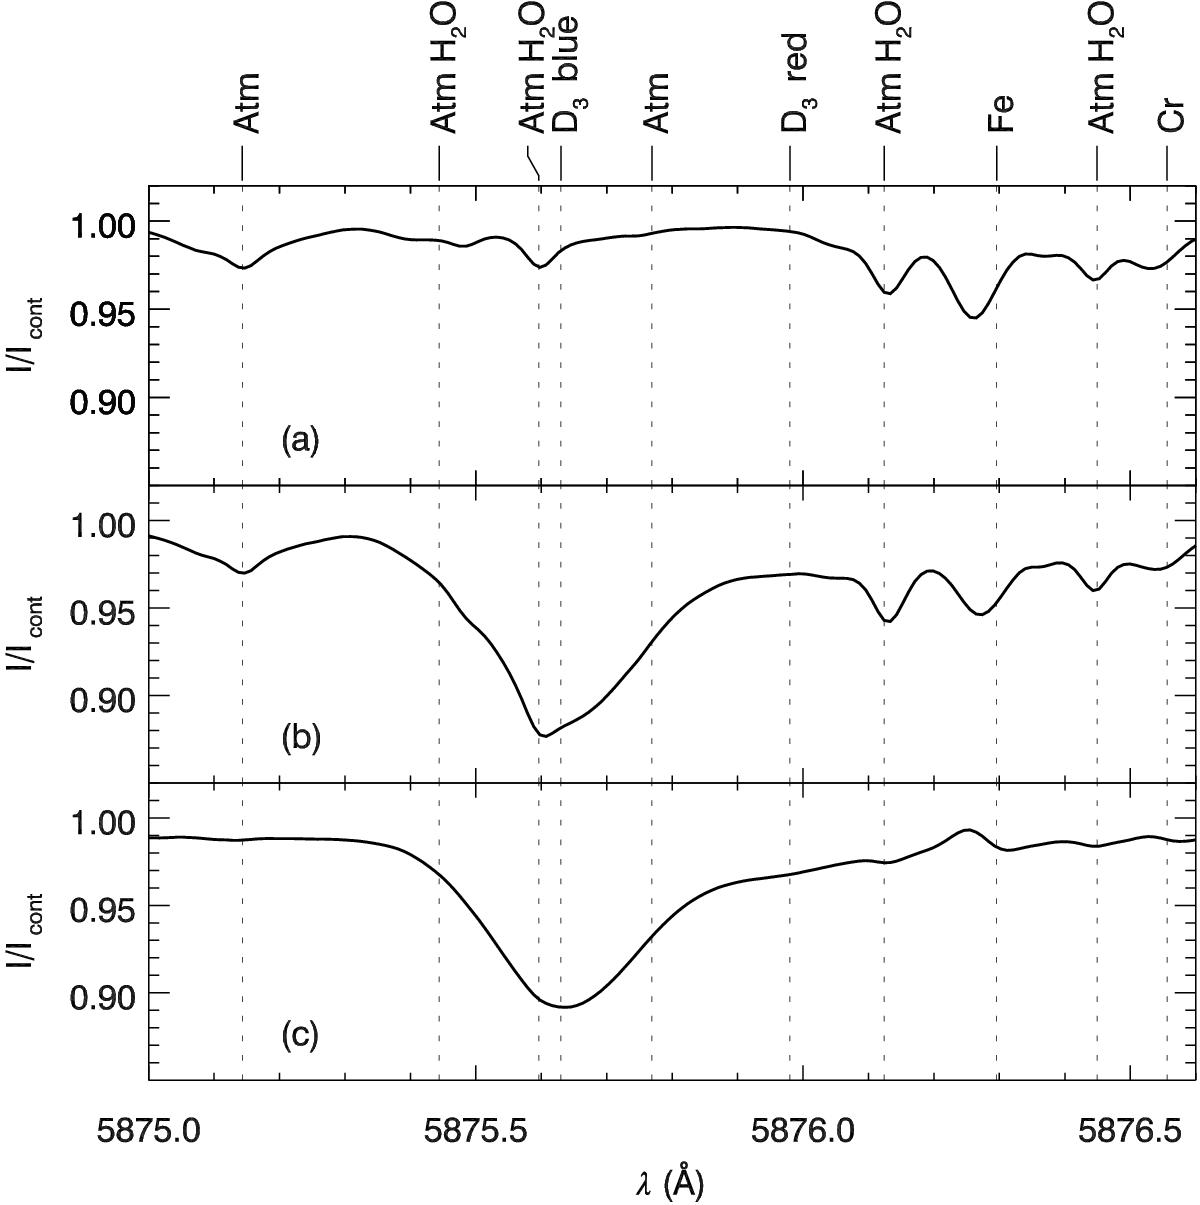
Demonstration of the correction for telluric blends with the He i D3 line. Panel a) shows the reference quiet sun spectrum containing the blends but not any He i D3 signal. Panel b) shows the original spectral region including blends in He i D3. Panel c) shows the corrected He i D3 line (including the artefact at 5876.3 Å resulting from telluric correction).
Current usage metrics show cumulative count of Article Views (full-text article views including HTML views, PDF and ePub downloads, according to the available data) and Abstracts Views on Vision4Press platform.
Data correspond to usage on the plateform after 2015. The current usage metrics is available 48-96 hours after online publication and is updated daily on week days.
Initial download of the metrics may take a while.