Fig. 12
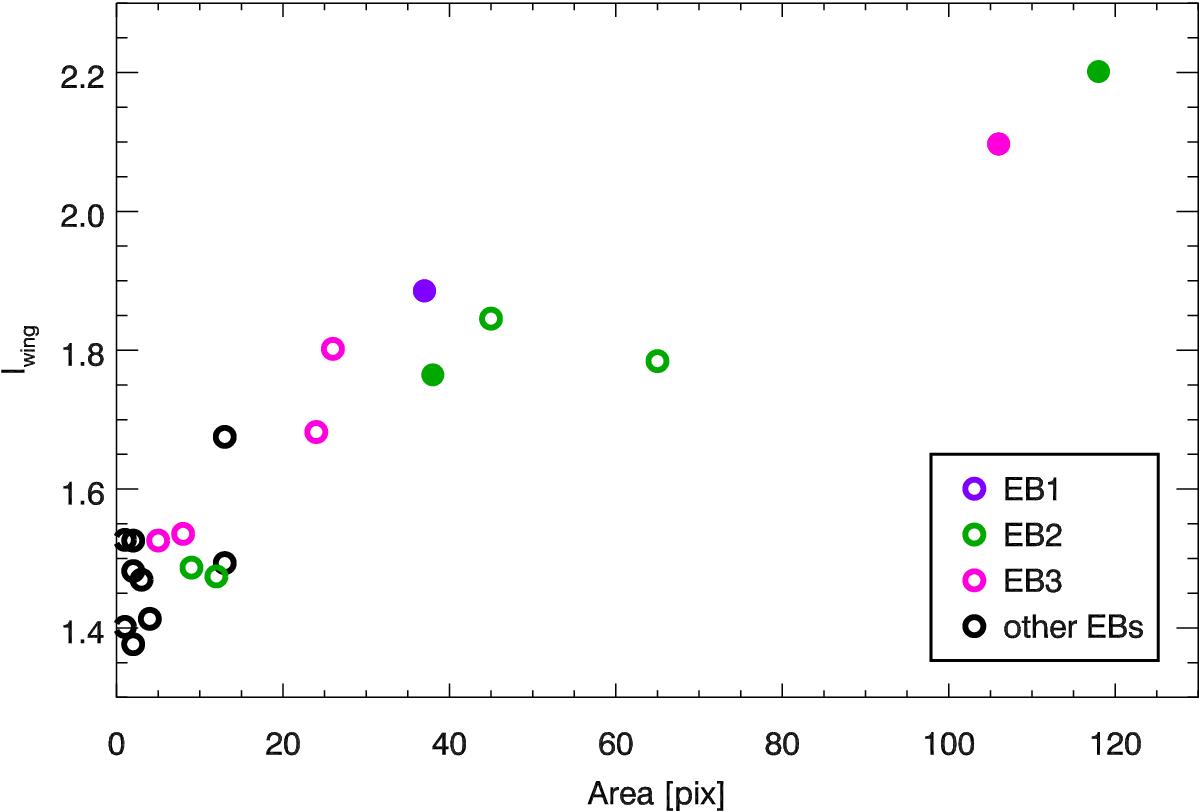
EB1 is shown in purple, EB2 is shown in green and EB3 is shown in pink. The black circles correspond to the other EBs in our data, which do not show emission signals in He i D3. The different data points correspond to different time steps in which the EBs were detected. The filled circles are the detections showing emission in He i D3.
Current usage metrics show cumulative count of Article Views (full-text article views including HTML views, PDF and ePub downloads, according to the available data) and Abstracts Views on Vision4Press platform.
Data correspond to usage on the plateform after 2015. The current usage metrics is available 48-96 hours after online publication and is updated daily on week days.
Initial download of the metrics may take a while.