Fig. 10
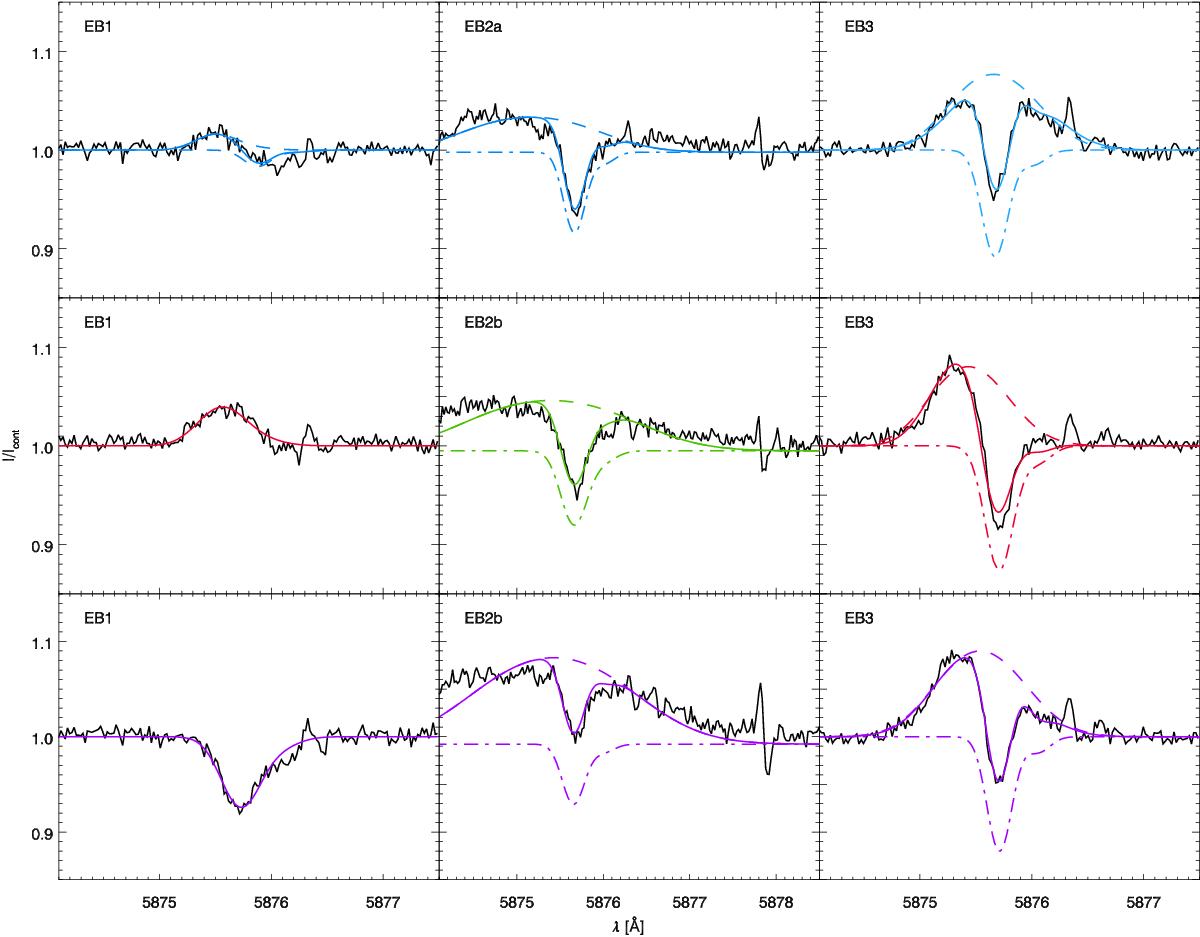
Inversion results for EB profiles. The observed profile is shown as a black solid line. The colours of the fits correspond to the colours of the spectra, shown in Figs. 6–8. The total fit is given as a coloured solid line. The emission component (dashed line) and the absorption component (dash-dot line) are overplotted. The red and purple fit for EB1 have been obtained using only one component (solid line). The values for the parameters are shown in Table 4.
Current usage metrics show cumulative count of Article Views (full-text article views including HTML views, PDF and ePub downloads, according to the available data) and Abstracts Views on Vision4Press platform.
Data correspond to usage on the plateform after 2015. The current usage metrics is available 48-96 hours after online publication and is updated daily on week days.
Initial download of the metrics may take a while.