Fig. 1
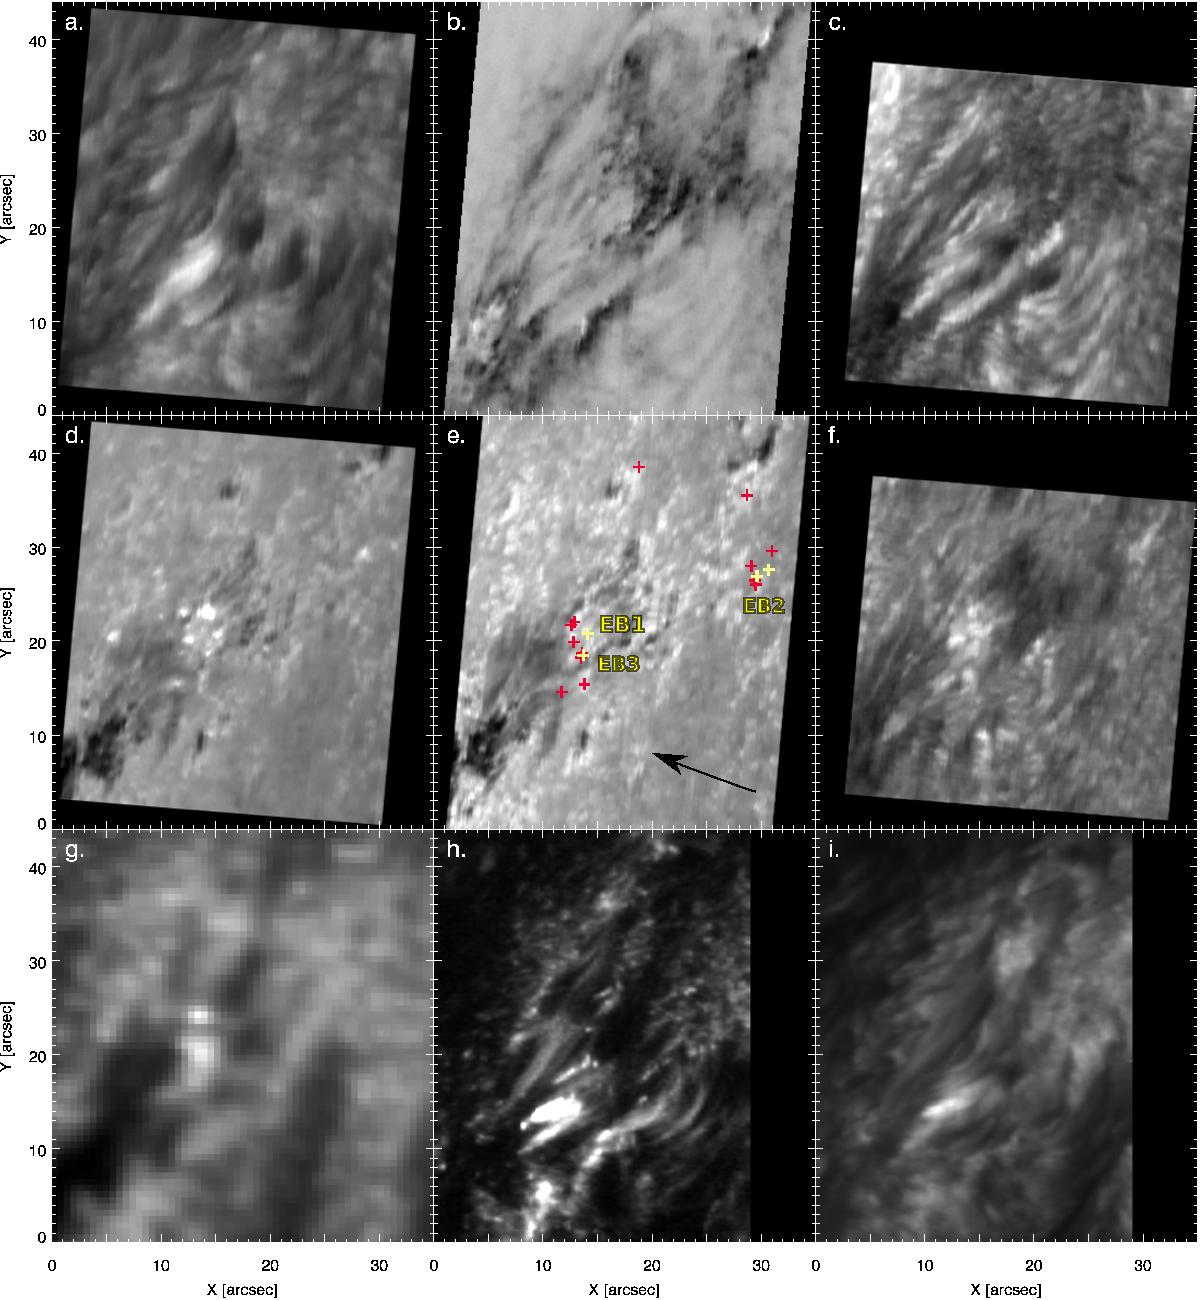
a)–f). Raster scan images observed with SST/TRIPPEL: a) Line core raster scan in Hβ. b) Continuum-corrected line core raster scan in He i D3. c) Line core raster scan in He i 10 830 Å. d) Line wing raster scan in Hβ−0.9Å. e) Line wing raster scan in He i D3+2.7Å. Red plusses represent EB locations. Yellow plusses represent EB locations showing emission in He i D3, corresponding to EB1, EB2 and EB3. EB2 is indicated by two yellow plusses because it is split into two bombs EB2a and EB2b, corresponding to the same event at a different time step. The black arrow indicates the disc-centre direction. f) Line core raster scan in Si i 10 827 Å. g) SDO/AIA 1700 Å image. h) Line core raster scan in Si iv 1400 Å , observed with IRIS. i) Line core raster scan in Mg ii 2976 Å, observed with IRIS.
Current usage metrics show cumulative count of Article Views (full-text article views including HTML views, PDF and ePub downloads, according to the available data) and Abstracts Views on Vision4Press platform.
Data correspond to usage on the plateform after 2015. The current usage metrics is available 48-96 hours after online publication and is updated daily on week days.
Initial download of the metrics may take a while.