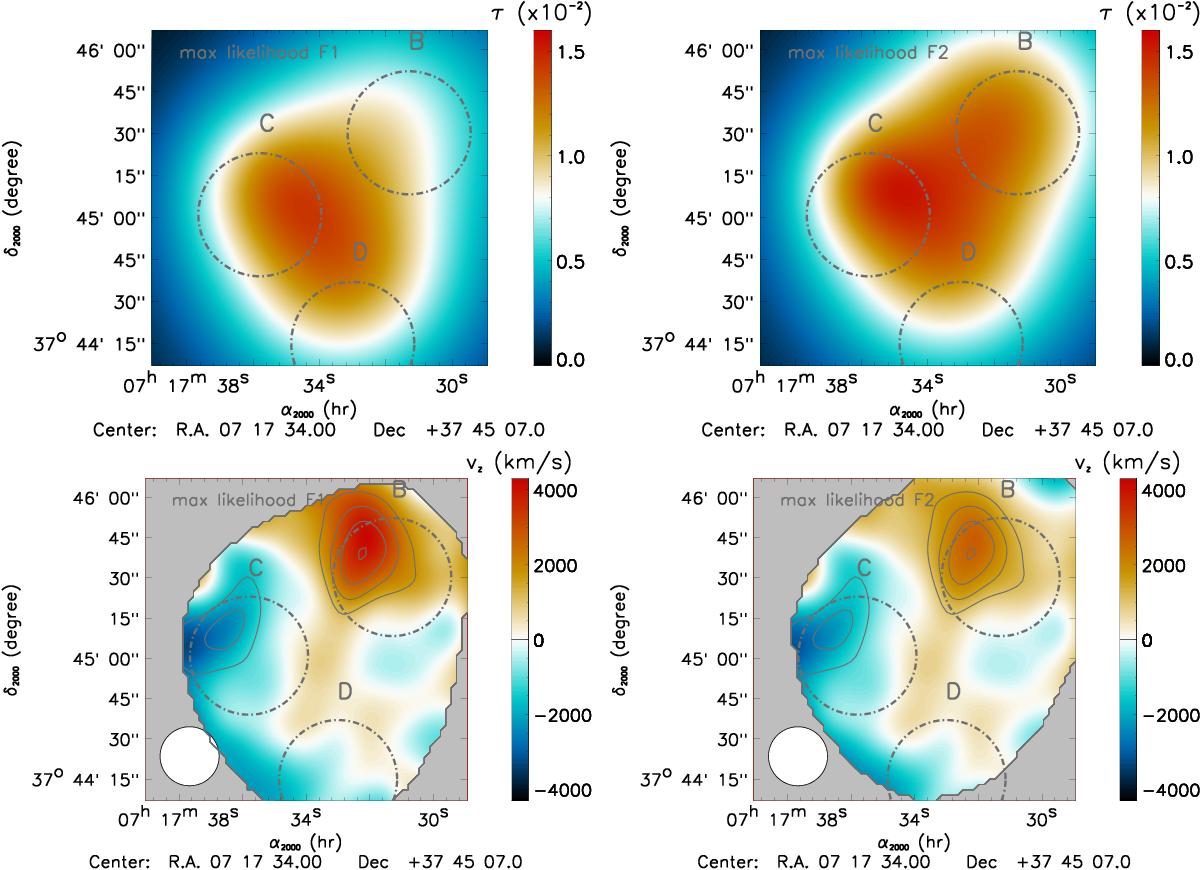
Fig. 9

Top: map of the best-fit optical depth model. Bottom: projected gas line-of-sight velocity map. The resolution of the map is 22 arcsec FWHM as provided by the white circle in the bottom left corner. The left panels correspond to fit F1 and the right panels to fit F2. Regions where the rms of the noise is larger than 3 times the minimum value have been masked for display purpose. Contours show the detection level of the velocity (thus proportional to that of the kSZ map of Fig. 5) and are spaced by 1σ, starting at ±2σ. We stress that they do not reflect the true uncertainty on the velocity because they do not account for the statistical and systematic effect of the optical depth models. The field shown in here is smaller than the other ones displayed in this paper.
Current usage metrics show cumulative count of Article Views (full-text article views including HTML views, PDF and ePub downloads, according to the available data) and Abstracts Views on Vision4Press platform.
Data correspond to usage on the plateform after 2015. The current usage metrics is available 48-96 hours after online publication and is updated daily on week days.
Initial download of the metrics may take a while.


