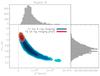
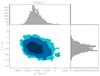
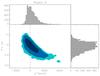
Fig. 8

Constraints of the model on the ICM distribution in the plane line-of-sight velocity – central optical depth, ![]() –
– ![]() , for subclusters B–D. The purple, dark blue and light blue are constraints contours at 68, 95 and 99% confidence limit in the case of our baseline fit (F1, without X-ray imaging prior on the gas density). For subcluster B, the red contours are similar to the blue ones in the case of the fit F2 (with the X-ray imaging prior). The marginalized probability density distribution are also given by the histograms in the case of F1. The dashed line give the zero location of the velocity axis. As discussed in the text, given the limitation of the models to describe the cluster, we stress that the error contours do not necessarily reflect the true underlying uncertainties.
, for subclusters B–D. The purple, dark blue and light blue are constraints contours at 68, 95 and 99% confidence limit in the case of our baseline fit (F1, without X-ray imaging prior on the gas density). For subcluster B, the red contours are similar to the blue ones in the case of the fit F2 (with the X-ray imaging prior). The marginalized probability density distribution are also given by the histograms in the case of F1. The dashed line give the zero location of the velocity axis. As discussed in the text, given the limitation of the models to describe the cluster, we stress that the error contours do not necessarily reflect the true underlying uncertainties.
Current usage metrics show cumulative count of Article Views (full-text article views including HTML views, PDF and ePub downloads, according to the available data) and Abstracts Views on Vision4Press platform.
Data correspond to usage on the plateform after 2015. The current usage metrics is available 48-96 hours after online publication and is updated daily on week days.
Initial download of the metrics may take a while.