Fig. 5
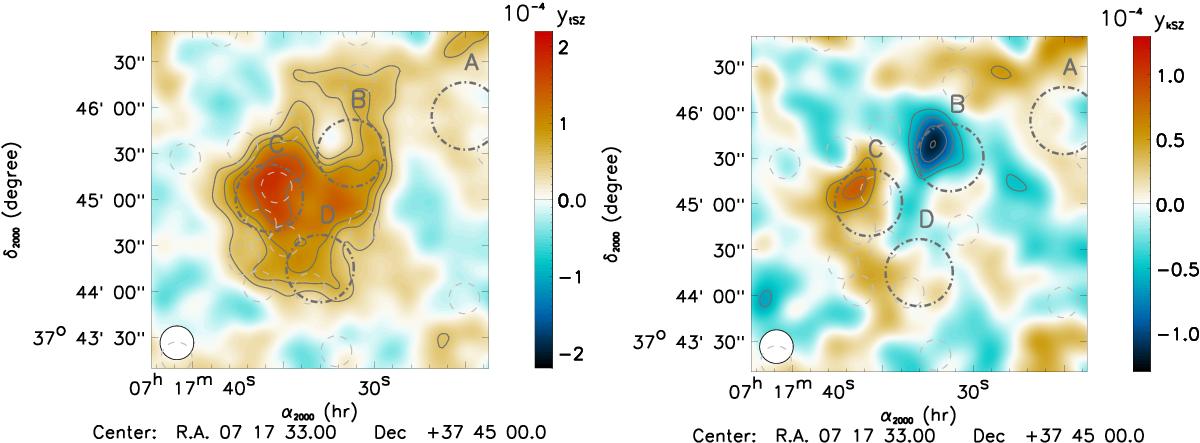
Map of the thermal SZ effect, ytSZ (left), and the kinetic SZ effect, ykSZ (right). Gray contours are multiples of 1σ, starting at ±2σ. The map effective resolution, 22 arcsec, is shown as a white circle on the bottom left corner. Subcluster regions are represented in gray. The positions of the identified point sources (see Sect. 3), from which mis-subtraction residuals remain a potential local contaminant to the signal, are represented in light gray.
Current usage metrics show cumulative count of Article Views (full-text article views including HTML views, PDF and ePub downloads, according to the available data) and Abstracts Views on Vision4Press platform.
Data correspond to usage on the plateform after 2015. The current usage metrics is available 48-96 hours after online publication and is updated daily on week days.
Initial download of the metrics may take a while.