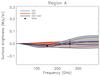
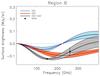
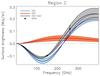
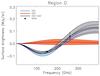
Fig. 4

Constraints on the kSZ and the tSZ amplitudes toward the regions associated with the four subclusters (from A to D). The black data points provide the average brightness measured by NIKA in the 22 arcsec radius regions with center coordinates given in Table 2 and shown in Fig. 1. The shaded areas give the 68% confidence level constraints on the kSZ (red), the tSZ (blue) and the sum of the two (gray). Possible point source residuals were masked when computing the average surface brightness.
Current usage metrics show cumulative count of Article Views (full-text article views including HTML views, PDF and ePub downloads, according to the available data) and Abstracts Views on Vision4Press platform.
Data correspond to usage on the plateform after 2015. The current usage metrics is available 48-96 hours after online publication and is updated daily on week days.
Initial download of the metrics may take a while.