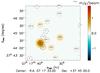
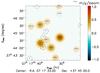
Fig. 2
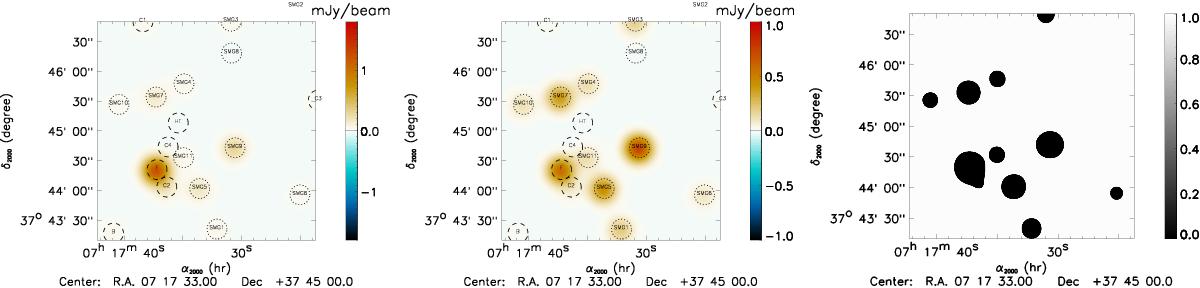
Point source model at 150 GHz (left) and 260 GHz (middle), and point source mask constructed from the 150 and 260 GHz point source models (right). The color scale of the models is the same as in Fig. 1. We also provide the labels of each source on the figure, in dashed circles for radio sources and dotted circles for submillimeter sources. The point sources subtracted maps can be seen in Fig. 7.
Current usage metrics show cumulative count of Article Views (full-text article views including HTML views, PDF and ePub downloads, according to the available data) and Abstracts Views on Vision4Press platform.
Data correspond to usage on the plateform after 2015. The current usage metrics is available 48-96 hours after online publication and is updated daily on week days.
Initial download of the metrics may take a while.