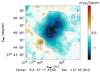
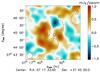
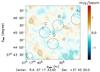
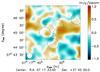
Fig. 1

Top: NIKA maps of MACS J0717.5+3745 at 150 GHz (left) and 260 GHz (right). The gray contours show the significance in units of standard deviation. They are multiples of 2σ at 150 GHz and 1σ at 260 GHz, starting at ±2σ. Both maps have been smoothed to have the same effective resolution of 22 arcsec FWHM, as represented by the white circle on the bottom left corner of the maps. The regions defined in Table 2 are shown as gray dot-dashed circles. Bottom: same as top-panel figures, in the case of half difference maps computed from two equivalent sub-samples. The steps between contours is 1σ for both frequencies.
Current usage metrics show cumulative count of Article Views (full-text article views including HTML views, PDF and ePub downloads, according to the available data) and Abstracts Views on Vision4Press platform.
Data correspond to usage on the plateform after 2015. The current usage metrics is available 48-96 hours after online publication and is updated daily on week days.
Initial download of the metrics may take a while.