Fig. 3
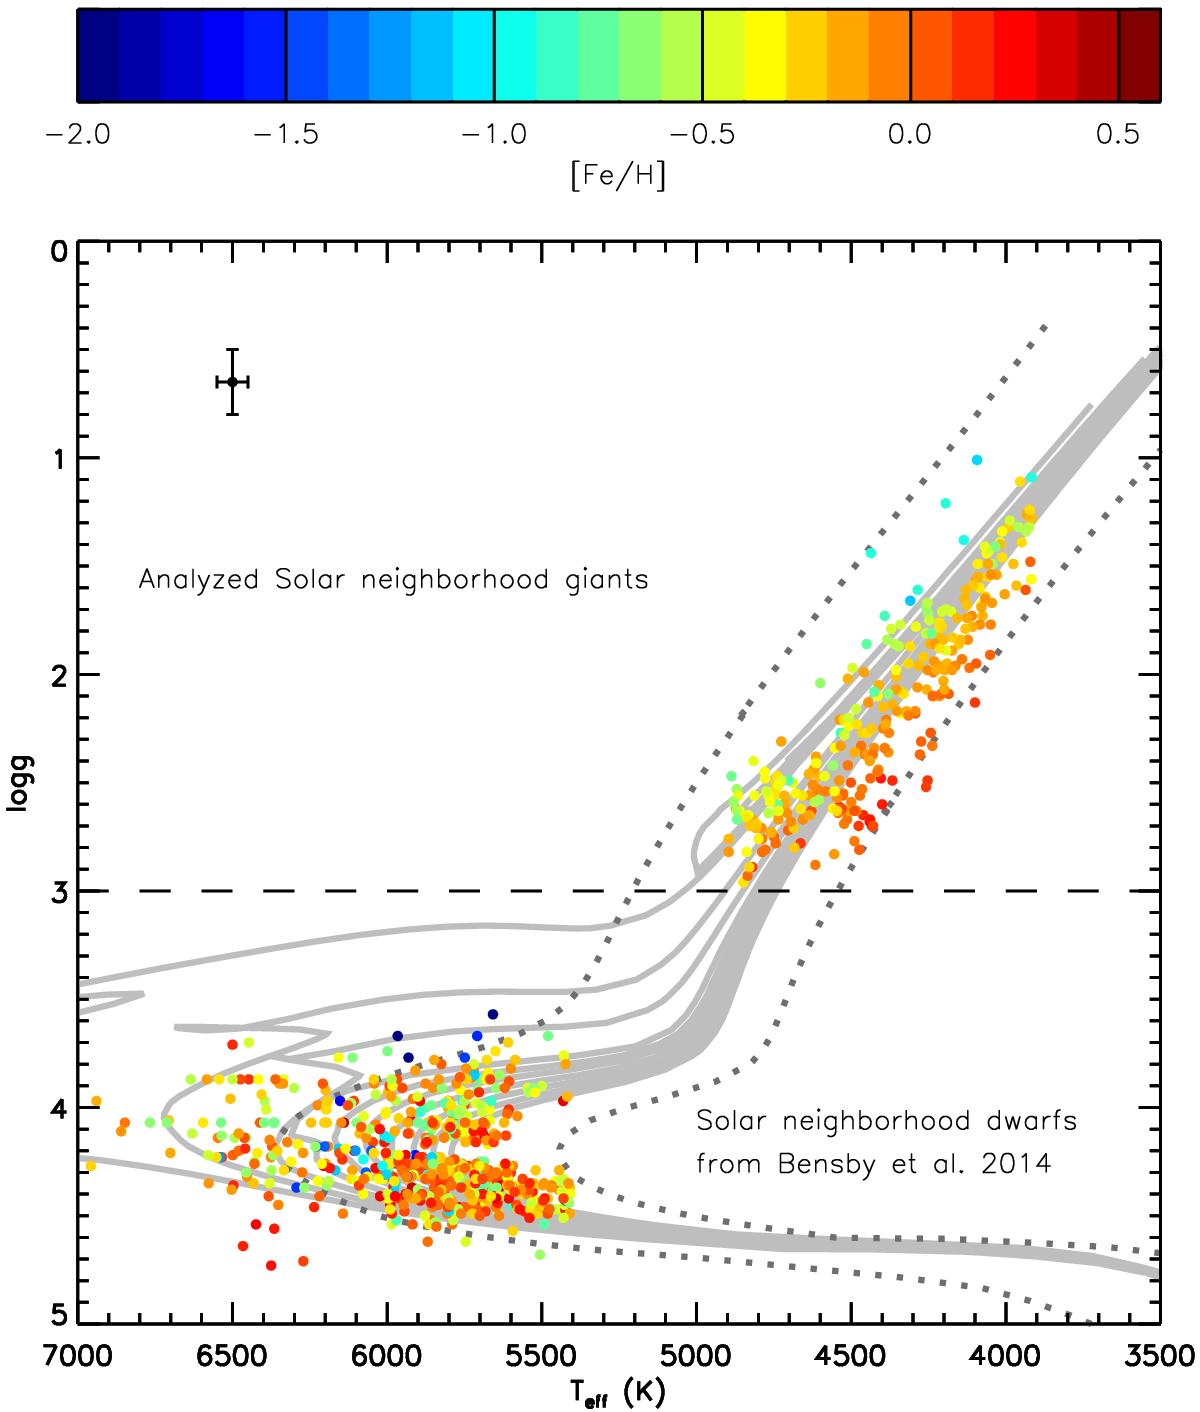
HR diagrams for the observed giants and the 604 solar neighborhood dwarfs of Bensby et al. (2014) with Teff> 5400 K. As a guide for the eye, isochrones with [Fe/H] = 0.0 and ages 1–10 Gyr are plotted using solid light gray lines. Furthermore, one isochrone with [Fe/H] =−1.0 and age 10 Gyr, and one with [Fe/H] = + 0.5 and age 10 Gyr are plotted using dotted dark gray lines (Bressan et al. 2012). The parameters of the analyzed giants are determined from spectroscopy as described in the text. They line up as expected from isochrones in both temperature and surface gravity as well as metallicity. Expected, typical uncertanties are denoted in the top left corner of the plot.
Current usage metrics show cumulative count of Article Views (full-text article views including HTML views, PDF and ePub downloads, according to the available data) and Abstracts Views on Vision4Press platform.
Data correspond to usage on the plateform after 2015. The current usage metrics is available 48-96 hours after online publication and is updated daily on week days.
Initial download of the metrics may take a while.