Fig. 1
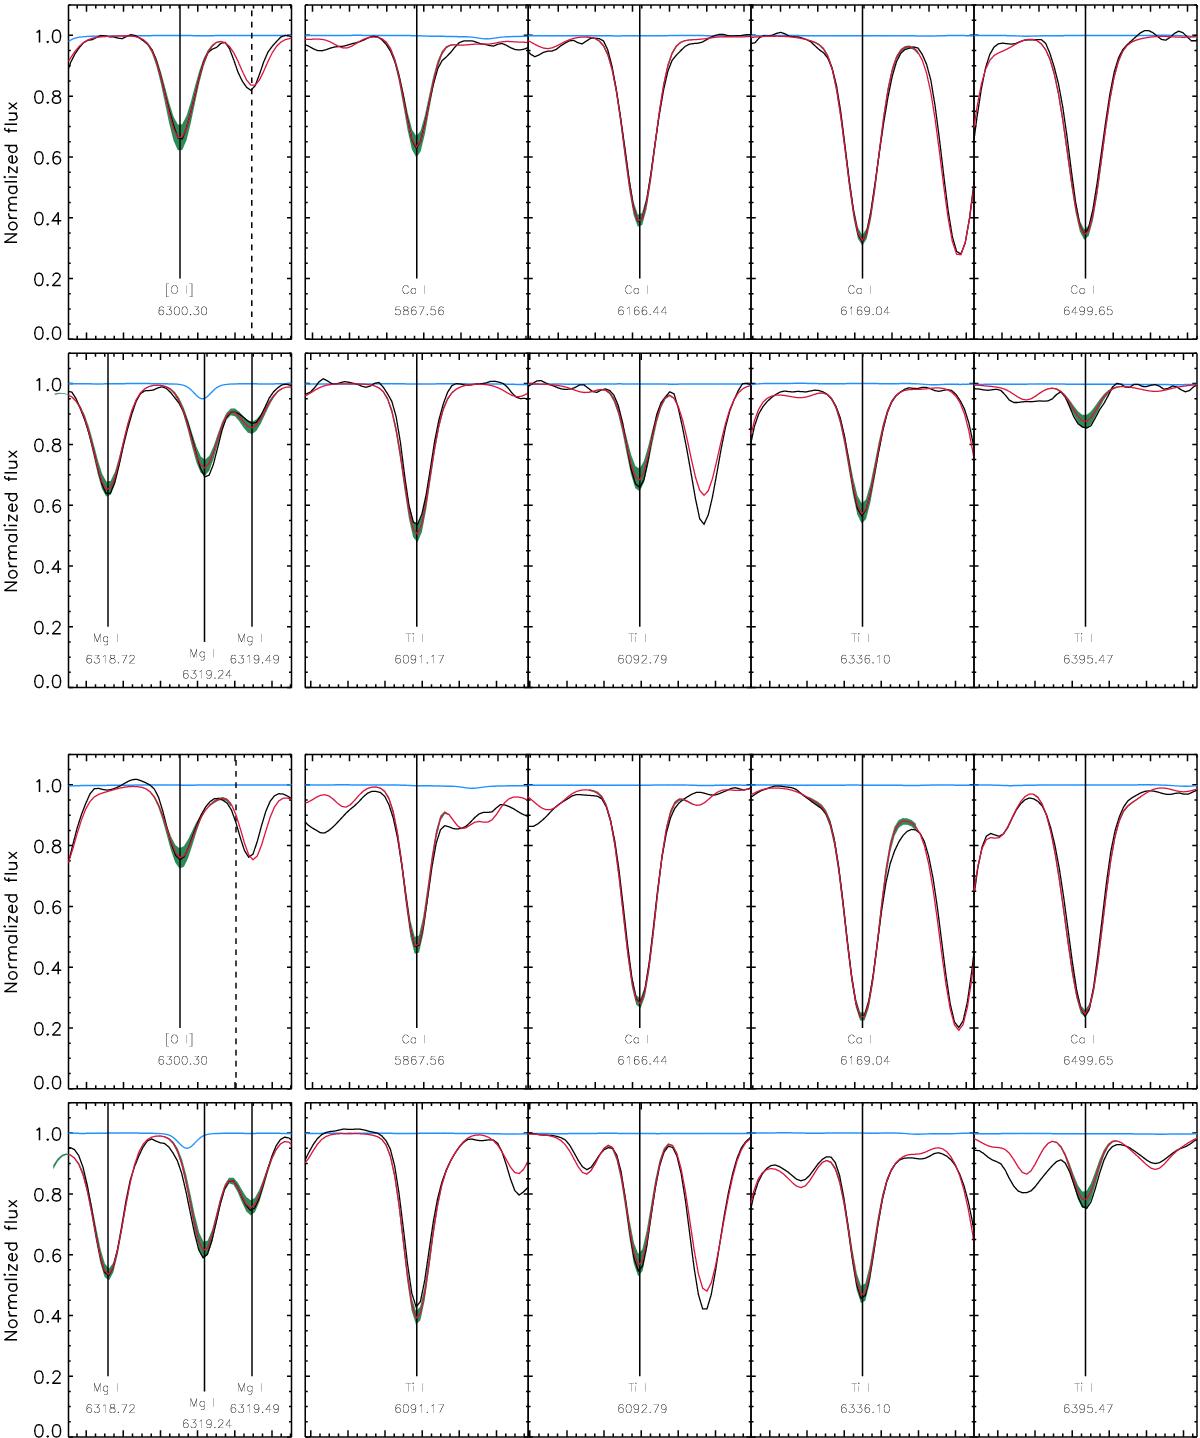
Stellar lines used for abundance determinations in the analyzed FIES spectra of Arcturus and μLeo in the top and bottom two rows, respectively. The stellar spectrum is shown in black, the best-fitting synthetic spectrum in red, and ±0.1 dex of the element in question in green. The telluric spectrum from the Arcturus atlas of Hinkle et al. (2000) is shown in blue and the position of the bright 6300 Å sky emission line is shown with a dashed line. Stellar lines possibly affected by telluric absorption lines and/or sky emission lines were avoided in the analysis. All panels show 1.2 Å of spectra surrounding the line in question, i.e., the larger tickmarks indicate steps of 0.2 Å.
Current usage metrics show cumulative count of Article Views (full-text article views including HTML views, PDF and ePub downloads, according to the available data) and Abstracts Views on Vision4Press platform.
Data correspond to usage on the plateform after 2015. The current usage metrics is available 48-96 hours after online publication and is updated daily on week days.
Initial download of the metrics may take a while.