Free Access
Fig. 7
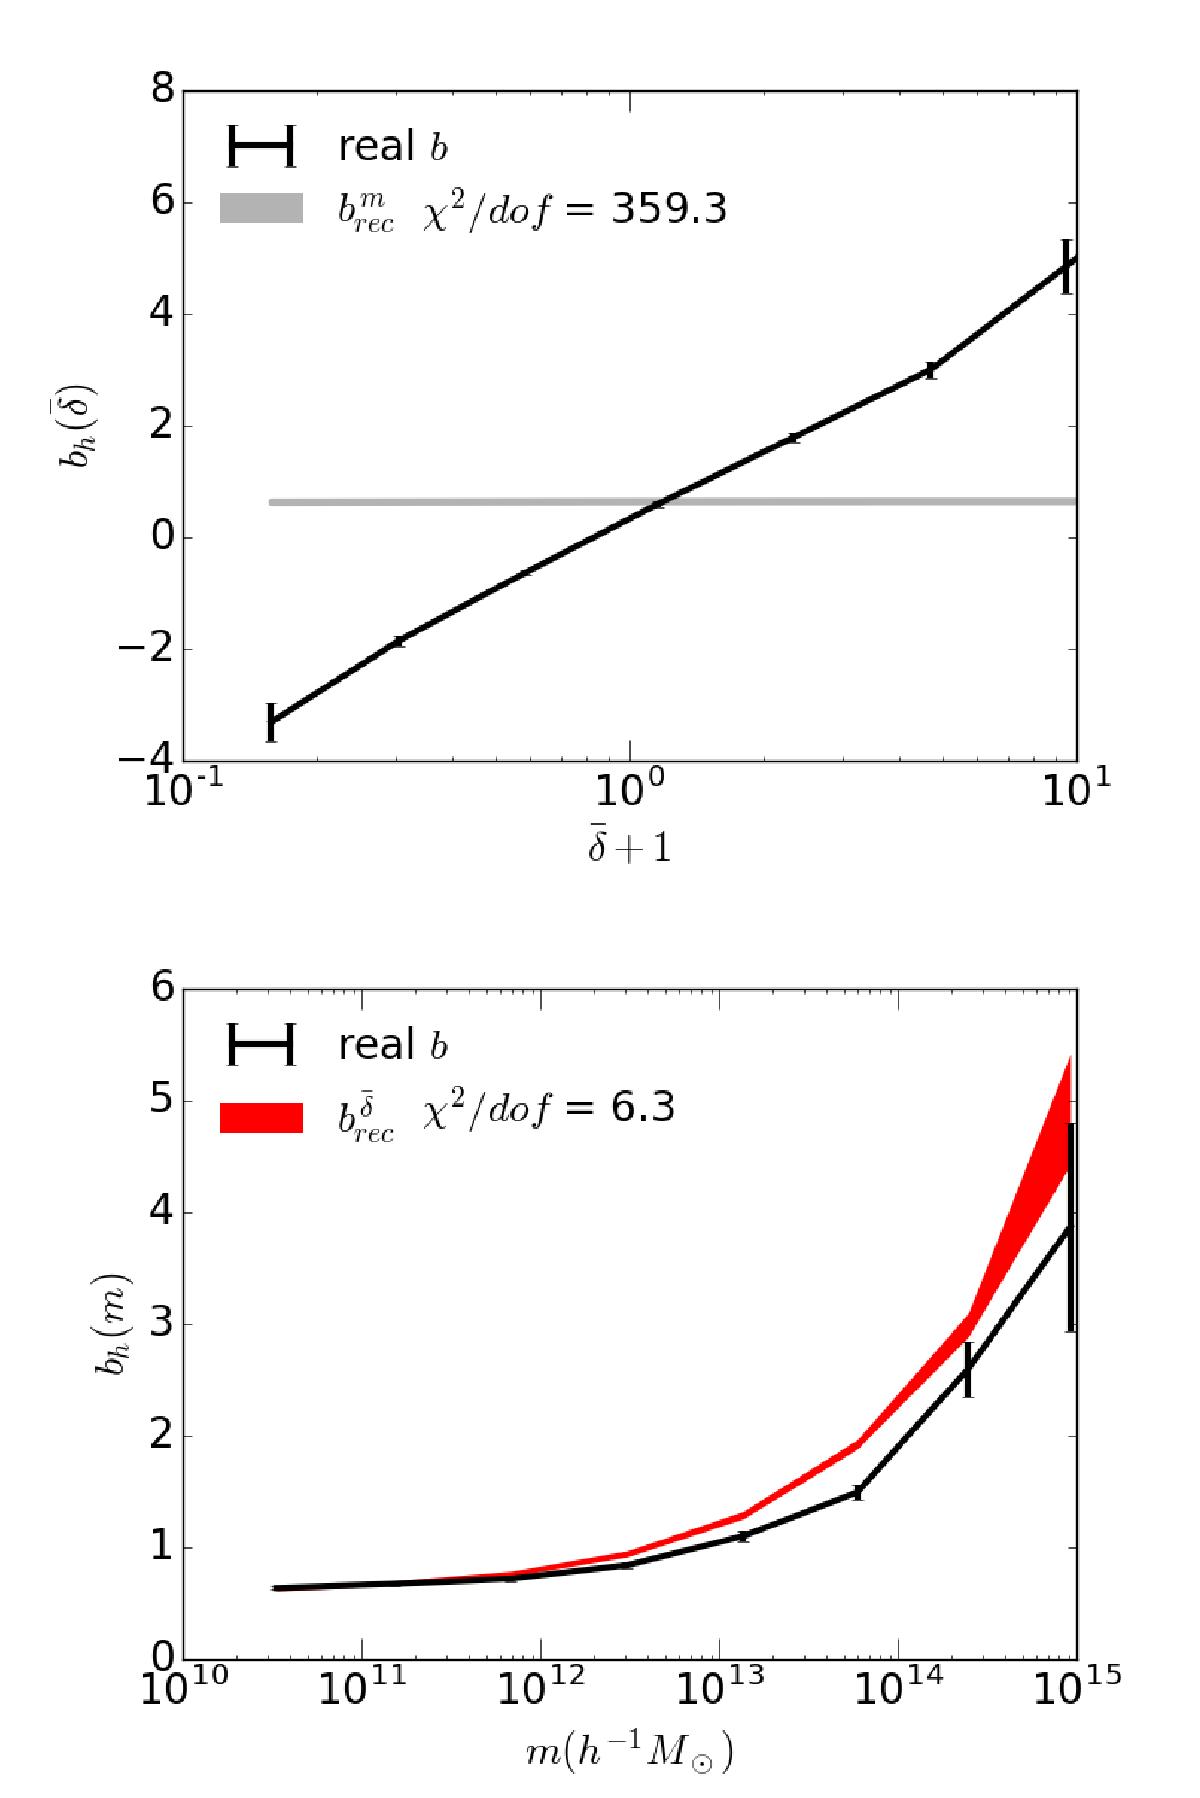
Halo bias reconstructions compared to the measured bias from the simulation. The solid black lines show the measurement of bh from the simulation. The coloured regions show the 1σ interval of the reconstructions. The top panel shows ![]() (in grey) from bh(m), while the bottom panel shows
(in grey) from bh(m), while the bottom panel shows ![]() (in red) from
(in red) from ![]() .
.
This figure is made of several images, please see below:


Current usage metrics show cumulative count of Article Views (full-text article views including HTML views, PDF and ePub downloads, according to the available data) and Abstracts Views on Vision4Press platform.
Data correspond to usage on the plateform after 2015. The current usage metrics is available 48-96 hours after online publication and is updated daily on week days.
Initial download of the metrics may take a while.