Free Access
Fig. 4
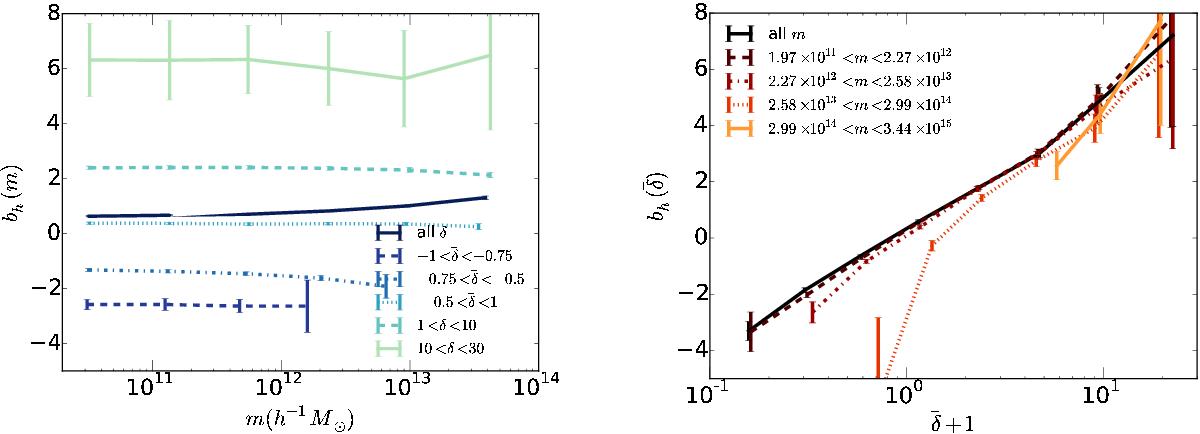
Left: halo bias as a function of mass. Each line corresponds to haloes in a fixed density fluctuations ![]() . Right: halo bias as a function of the local density
. Right: halo bias as a function of the local density ![]() . Each line corresponds to a different halo mass bin. In both panels,
. Each line corresponds to a different halo mass bin. In both panels, ![]() is defined as the Eulerian density fluctuation around a cubic box of 14 h-1 Mpc of side.
is defined as the Eulerian density fluctuation around a cubic box of 14 h-1 Mpc of side.
This figure is made of several images, please see below:
Current usage metrics show cumulative count of Article Views (full-text article views including HTML views, PDF and ePub downloads, according to the available data) and Abstracts Views on Vision4Press platform.
Data correspond to usage on the plateform after 2015. The current usage metrics is available 48-96 hours after online publication and is updated daily on week days.
Initial download of the metrics may take a while.