Free Access
Fig. 4
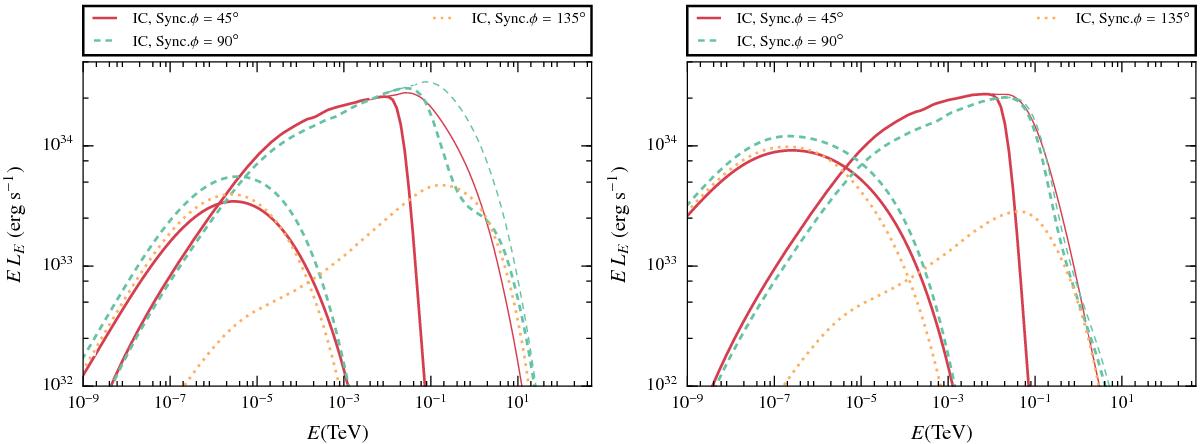
Spectral energy distribution of synchrotron and IC for the no clump scenario, in the low (χB = 10-3) and high (χB = 0.1) magnetic field cases (left and right, respectively). We note that the unabsorbed (thin lines) and the absorbed (thick lines) IC emission are distinguishable only for φ = 45° and 90°.
This figure is made of several images, please see below:
Current usage metrics show cumulative count of Article Views (full-text article views including HTML views, PDF and ePub downloads, according to the available data) and Abstracts Views on Vision4Press platform.
Data correspond to usage on the plateform after 2015. The current usage metrics is available 48-96 hours after online publication and is updated daily on week days.
Initial download of the metrics may take a while.