Fig. 1
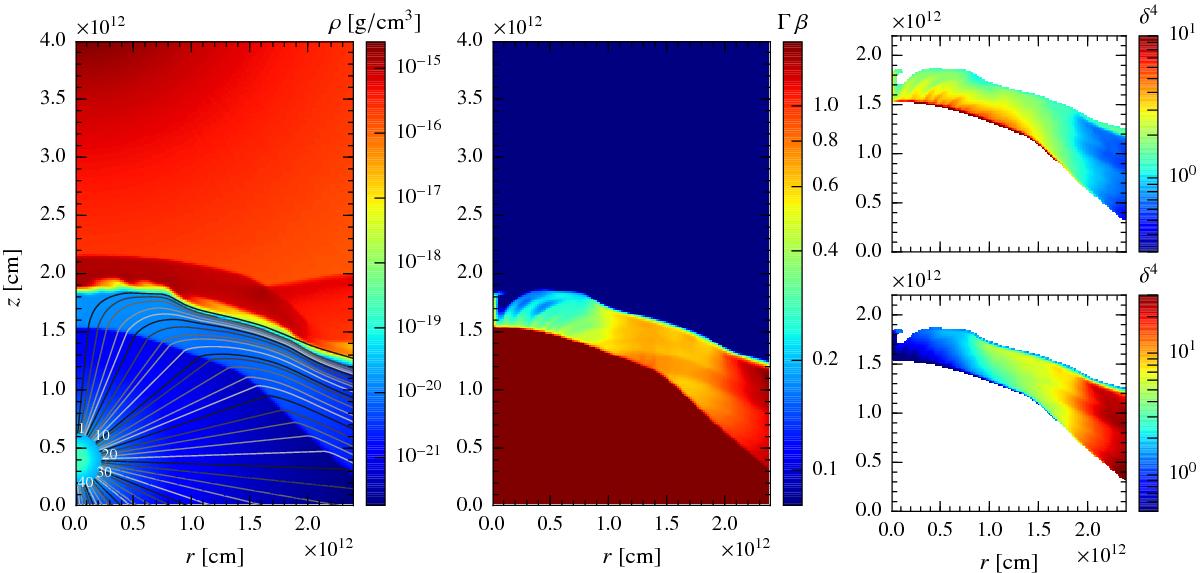
Left panel: density distribution by colour at time t = 5.8 × 10⁴ s in the (quasi)-steady state. The star is located at (r∗,z∗) = (0,4.8 × 1012) cm and the pulsar wind is injected at a distance of 2.4 × 1011 cm with respect the pulsar centre at (rp,zp) = (0,4 × 10¹¹) cm. The grey lines show the obtained streamlines describing the trajectories of the pulsar wind fluid cells; the grey scale and the numbers are only for visualization purposes. Centre panel: distribution by colour of the module of the three-velocity at time t = 5.8 × 10⁴ s in the (quasi)-steady state. Right panel: distribution by colour of the Doppler boosting enhancement (δ4) for the emission produced in the shocked pulsar wind, as seen from 45° (top) and 135° (bottom) from the pulsar-star axis, at time t = 5.8 × 10⁴ s in the (quasi)-steady state.
Current usage metrics show cumulative count of Article Views (full-text article views including HTML views, PDF and ePub downloads, according to the available data) and Abstracts Views on Vision4Press platform.
Data correspond to usage on the plateform after 2015. The current usage metrics is available 48-96 hours after online publication and is updated daily on week days.
Initial download of the metrics may take a while.