Free Access
Fig. 4
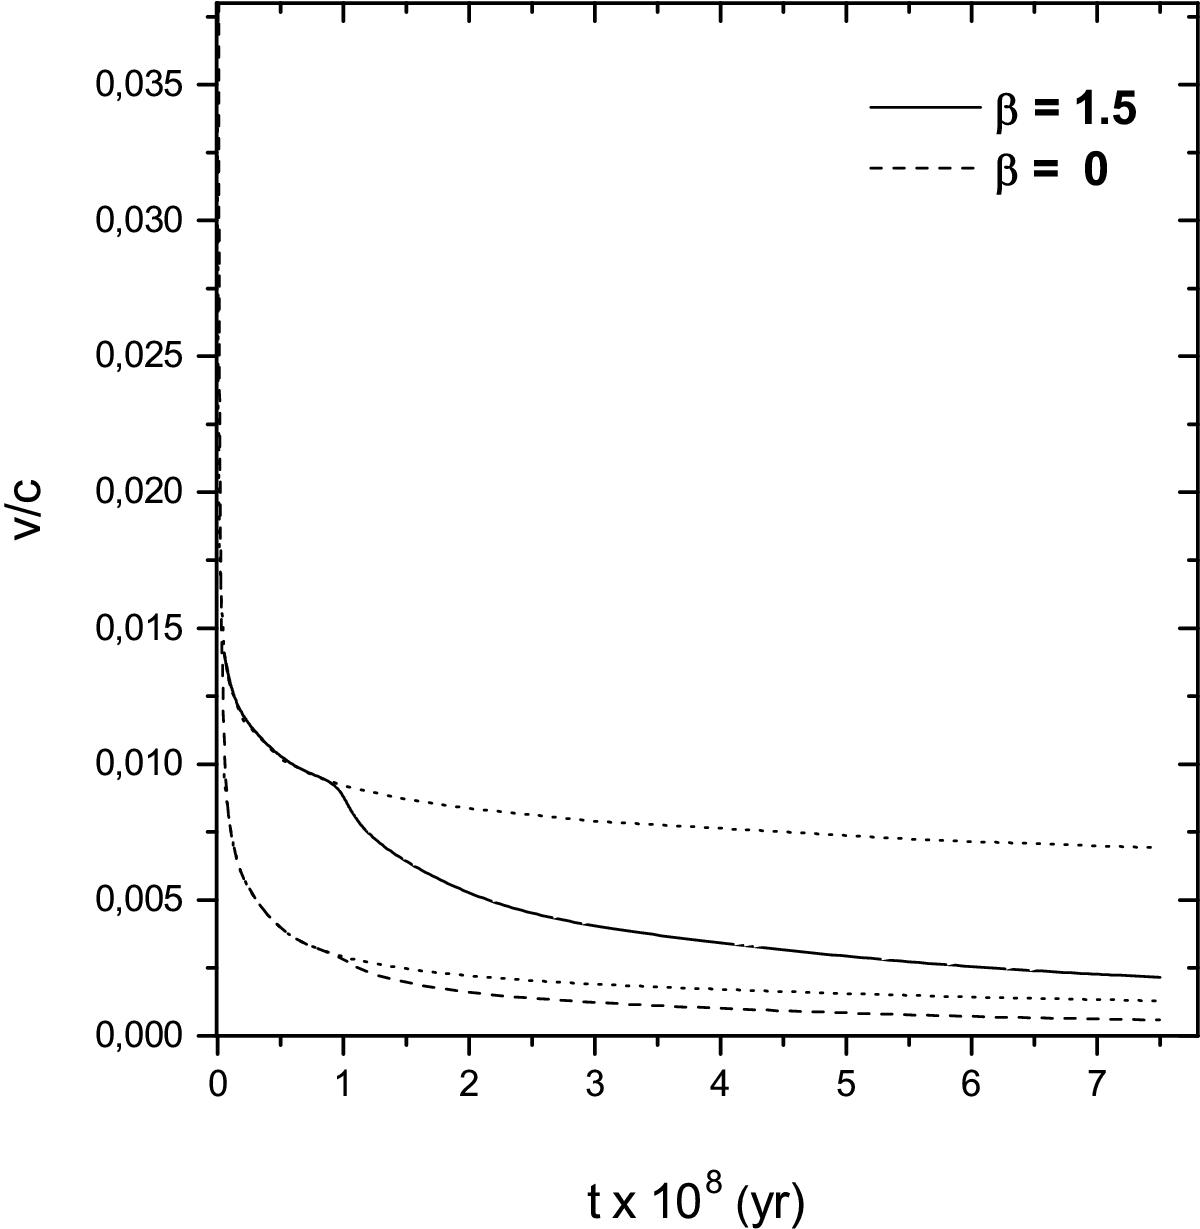
Velocity of the expanding lobes vs. time. Solid and dashed curves correspond to the KDA EXT and dotted lines follow the KDA model of continuous activity. Parameters are the same as in Fig. 1, but with tbr = 100 Myr and Γc = 5/3.
Current usage metrics show cumulative count of Article Views (full-text article views including HTML views, PDF and ePub downloads, according to the available data) and Abstracts Views on Vision4Press platform.
Data correspond to usage on the plateform after 2015. The current usage metrics is available 48-96 hours after online publication and is updated daily on week days.
Initial download of the metrics may take a while.