Fig. 1
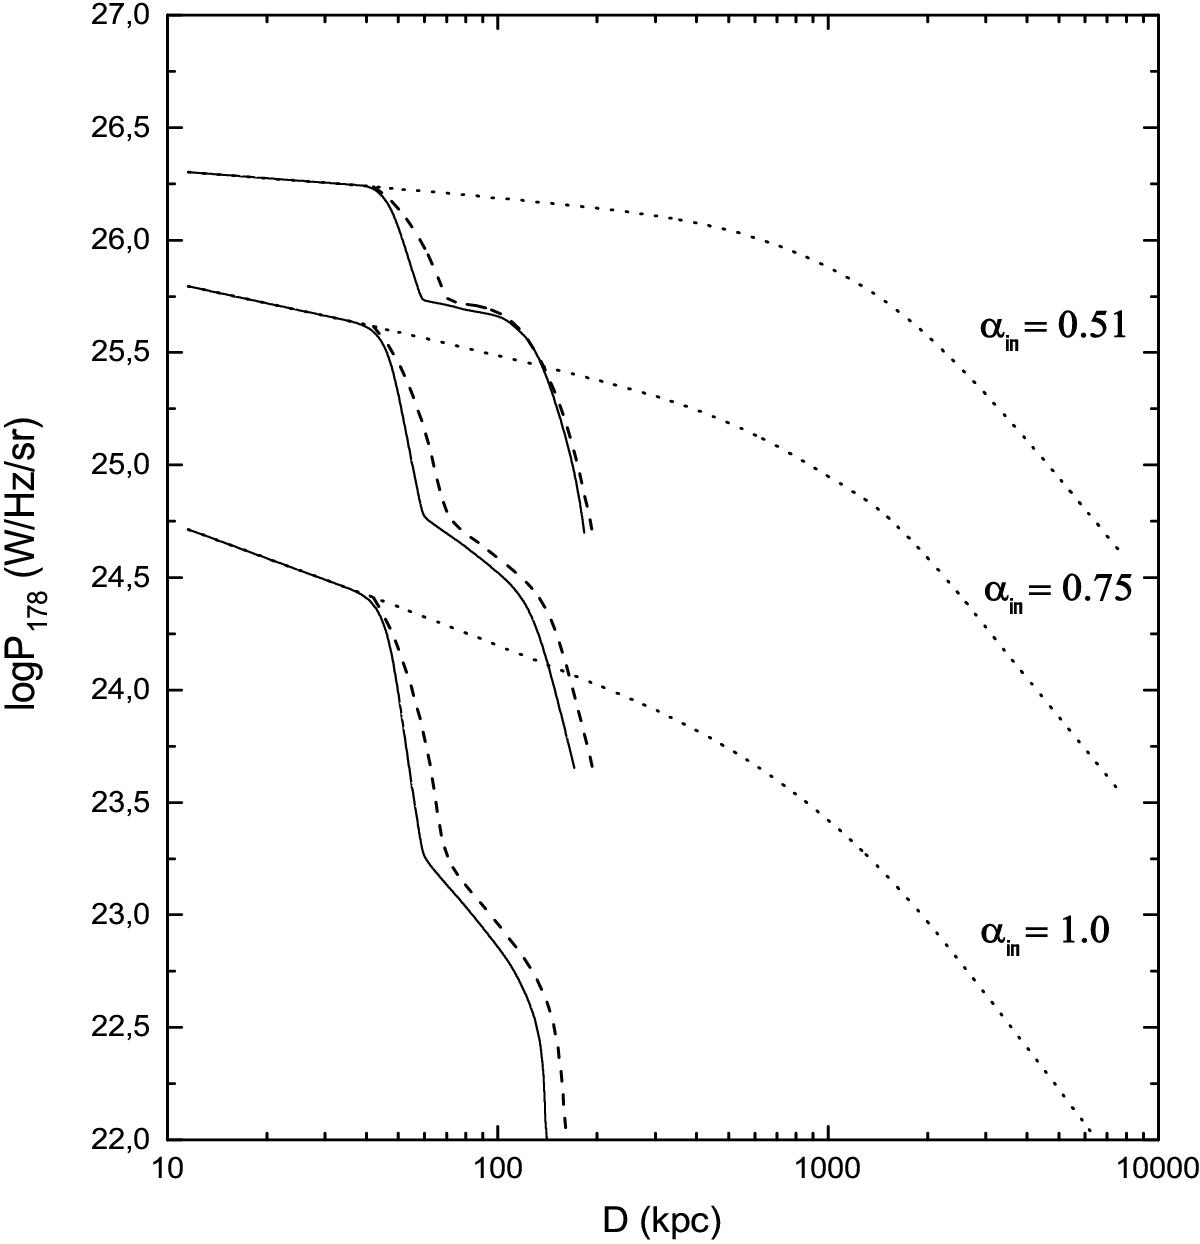
Comparison of the P178-D diagrams predicted with the KDA and KDA EXT model for the fiducial source with three different values of αinj and tbr = 10 Myr. The solid and dashed lines show predictions of the KDA EXT model for the two limiting cases of the internal sound speed (see the text). The dotted lines show predictions of the pure KDA model. All the KDA EXT diagrams are cut off at the points where their radio powers rapidly diminish and linear sizes tend to a constant value.
Current usage metrics show cumulative count of Article Views (full-text article views including HTML views, PDF and ePub downloads, according to the available data) and Abstracts Views on Vision4Press platform.
Data correspond to usage on the plateform after 2015. The current usage metrics is available 48-96 hours after online publication and is updated daily on week days.
Initial download of the metrics may take a while.