| Issue |
A&A
Volume 598, February 2017
|
|
|---|---|---|
| Article Number | A132 | |
| Number of page(s) | 9 | |
| Section | Cosmology (including clusters of galaxies) | |
| DOI | https://doi.org/10.1051/0004-6361/201629003 | |
| Published online | 13 February 2017 | |
Probing modified gravity via the mass-temperature relation of galaxy clusters
Institute of Theoretical Astrophysics, University of Oslo, PO Box 1029, Blindern, 0315 Oslo, Norway
e-mail: This email address is being protected from spambots. You need JavaScript enabled to view it.
; This email address is being protected from spambots. You need JavaScript enabled to view it.
Received: 26 May 2016
Accepted: 11 October 2016
Abstract
We propose that the mass-temperature relation of galaxy clusters is a prime candidate for testing gravity theories beyond Einstein’s general relativity, for modified gravity models with universal coupling between matter and the scalar field. For non-universally coupled models, we discover that the impact of modified gravity can remain hidden from the mass-temperature relation. Using non-radiative hydrodynamic cosmological simulations, we find that in modified gravity the hydrostatic mass-temperature relation varies significantly from the standard gravity relation of M ∝ T1.73. To be specific, for symmetron models with a coupling factor of β = 1 we find a lower limit to the power law as M ∝ T1.6; and for f(R) gravity we compute predictions based on the model parameters. We show that the mass-temperature relation, for screened modified gravities, is significantly different from that of standard gravity for the less massive and colder galaxy clusters, while being indistinguishable from Einstein’s gravity for massive, hot galaxy clusters. We further investigate the mass-temperature relation for other mass estimates than the hydrostatic mass estimate and discover that the gas mass-temperature results show even more significant deviations from Einstein’s gravity than the hydrostatic mass-temperature.
Key words: gravitation / hydrodynamics / galaxies: clusters: general / X-rays: galaxies: clusters / large-scale structure of Universe
© ESO, 2017
1. Introduction
Ever since the discovery that the Universe is undergoing a late-time accelerated expansion (Riess et al. 1998) the biggest challenge within the field has been to argue why this is happening. The two main hypothesis are that the expansion is driven by some unknown exotic component known as dark energy (Frieman et al. 2008), or that the accelerated expansion is the sign that general relativity needs to be modified at large scales (Clifton et al. 2012; Brans & Dicke 1961).
The biggest challenge of modified gravity theories is to alter the behaviour of gravity on large scales, where the accelerated expansion is observed, while leaving the gravity interaction on smaller scales unchanged, and where general relativity has been tested with high precision (Hoyle et al. 2004; Dimopoulos et al. 2007; Bertotti et al. 2003; Everitt et al. 2011). To accomplish this, several screening mechanisms have been proposed (Khoury 2010; Brax et al. 2012). In this paper, we study two specific cases, the chameleon f(R)-gravity (Hu & Sawicki 2007) and the symmetron scalar tensor theory (Hinterbichler & Khoury 2010). We note however that our results are valid for a general class of theories of modified gravity.
Modifying general relativity at cosmological scales affects structure formation. In the case of theories with a screening mechanism, the main signatures occur in the non-linear regime and at galaxy cluster scales. Performing dark-matter only N-body simulations within these modified gravity theories is therefore a promising way of probing their effects (Oyaizu 2008; Llinares et al. 2008; Li et al. 2011, 2012, 2013; Zhao et al. 2011; Llinares et al. 2014; Brax et al. 2013; Llinares & Mota 2014; Gronke et al. 2014; Winther et al. 2012). However, there is a major pitfall in this type of approach: to test these theories against observations, we need to compute real observables, such as X-ray observables. These cannot be directly calculated from dark-matter-only simulations, since experiments only measure photons which are, in fact, emitted from the baryonic matter.
This raises a major question: what observables from the simulations would be best suited to compare with observations, to put stronger constraints on modified gravity theories and test Einstein’s general relativity? To tackle this crucial problem, N-body simulations for modified gravity theories have started to include hydrodynamics to simulate the behaviour and observables associated with baryons (Hammami et al. 2015; Hammami & Mota 2015; Puchwein et al. 2013; Arnold et al. 2014). Cluster properties such as halo profiles and probability distribution functions have been computed and, lately, the gas-fraction of the galaxy clusters and power-spectra have been suggested as viable candidates (Hammami & Mota 2015; Li et al. 2016).
In this paper, we propose using the mass-temperature relation of a galaxy cluster as a new and quite unique observable for testing gravity theories. We show that it can be used to set strong constraints on modified gravity theories and to test general relativity in a new region of the parameter space.
We also show that the mass-temperature relation is a very promising probe, in part due to the vast amount of new, high resolution X-ray data from XMM-Newton and Chandra, and also because of the quite specific signatures that different models predict. Therefore, allowing us to probe the nature of gravity at cluster scales.
In Sect. 2, we briefly introduce the theoretical framework for our chosen modified gravity theories and the mass-temperature relation. In Sect. 3, we discuss which observations to use and the various assumptions used in the literature. In Sect. 4, we describe our simulations and how we calculate the mass-temperature relation. In Sect. 5, we show the results from our simulations and compare them to the observations from Sect. 3. We summarize and give our final thoughts in Sect. 6.
2. Theory
2.1. Modified gravity
The symmetron model and f(R)-gravity are both scalar-tensor theories of gravity that can be defined by the same general action ![Mathematical equation: \begin{eqnarray} \label{action} S = \int {\rm d}^4x\sqrt{-g}\left[\frac{R}{2}M_{\rm pl} - \frac{1}{2}\partial^i\varphi\partial_i\varphi - V(\varphi)\right] + S_m(\tilde{g}_{\mu\nu}, \varphi_i), \end{eqnarray}](/articles/aa/full_html/2017/02/aa29003-16/aa29003-16-eq7.png) (1)where R is the Ricci scalar, Mpl is the Planck mass, ϕ is the scalar field, V(ϕ) is the potential, ψ are the matter fields, g is the determinant of the metric tensor gμν. The scalar field is conformally coupled to matter by the conformal factor
(1)where R is the Ricci scalar, Mpl is the Planck mass, ϕ is the scalar field, V(ϕ) is the potential, ψ are the matter fields, g is the determinant of the metric tensor gμν. The scalar field is conformally coupled to matter by the conformal factor  , which results in an extra, fifth, force of the form
  (2)
(2)
2.1.1. Symmetron
The symmetron model (Hinterbichler & Khoury 2010) possesses a screening mechanism that is sensitive to the local density. If the density is high, the scalar degree of freedom decouples from matter, and the fifth force becomes negligible. In regions of low density, the coupling between matter and the extra field is strong, and the fifth force reaches its maximum value. This mechanism is ensured by having a symmetric coupling function and potential, around the value ϕ = 0,  (3)and
  (4)where M and μ are mass scales and λ is a dimensionless parameter. These free parameters can be recast to parameters with a more intuitive physical interpretation
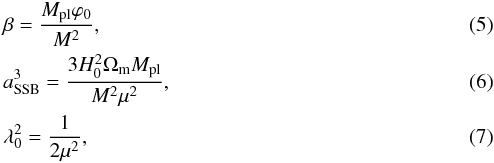 where ϕ0 is the scalar field minimum, which vanishes in regions of high density, H0 is the Hubble constant and Ωm is the matter density parameter of the Universe. These parameters now represent
-
β – the strength of the scalar field, and therefore the amplitude of the fifth force;
-
aSSB – the expansion factor of the Universe at the time of symmetry breaking. Prior to this the density of the Universe had the fifth force permanently screened;
-
λ0 – the range of the fifth force, in units of Mpc h-1.
With the symmetron coupling function, the fifth force becomes  (8)In the last step a switch to super-comoving coordinates has been made, as detailed in Hammami et al. (2015), Hammami & Mota (2015).
2.1.2. f(R)-gravity
The f(R)-gravity models are a set of extended gravity theories where the Einstein-Hilbert Lagrangian density ℒEH = R is replaced by a more general function of the Ricci scalar f(R).
The action describing the f(R)-gravity theories, ![Mathematical equation: \begin{eqnarray} S = \int\sqrt{-g}\left[\frac{R+f(R)}{16\pi G} + \mathcal{L}_m\right]{\rm d}^4x, \label{husawick} \end{eqnarray}](/articles/aa/full_html/2017/02/aa29003-16/aa29003-16-eq33.png) (9)can be transformed to the form of the general action for scalar-tensor theories Eq. (1) using the conformal transformation
(9)can be transformed to the form of the general action for scalar-tensor theories Eq. (1) using the conformal transformation  (10)where the coupling factor is constant
  .
.
These theories possess a so-called chameleon screening mechanism, where the mass of the scalar field is dependent on the local density, which in turn decides the interaction range of the scalar field (Khoury & Weltman 2004). If the density is high, the scalar degree of freedom becomes very short ranged while, in low density, the range is large and deviations from general relativity reach their maximum value.
For this paper we will be working with the Hu-Sawicki f(R) model (Hu & Sawicki 2007)  (11)where
  and n, c1 and c2 are free parameters. We can reduce the number of free parameters to be n and fR0 by the relations
  (12)and
  (13)The range of the scalar degree of freedom is dependent on these parameters as
  .
.
With the Hu-Sawicki f(R)-gravity formalism, the fifth force becomes  (14)Further details can be found in our previous work (Hammami et al. 2015) or in the review by de Felice & Tsujikawa (2010).
2.2. Mass-temperature relation
The virial theorem that relates the kinetic energy T to the gravitational potential U,  (15)can be used to find a simple theoretical mass-temperature relation
  (16)valid at the virial radius rvir ≈ r200c1. The full expression is very complicated (Lilje 1992), consisting of cosmological parameters and the density profile.
Furthermore, some studies have shown (Del Popolo 2002) that the relation grows steeper for the low mass-temperature range, and that two separate power laws can describe the low mass-temperature and high mass-temperature range respectively. This claim is, however, in dispute with newer studies that show no evidence of this type of double slope (Stanek et al. 2010; Planelles et al. 2014).
Observational investigations of the mass-temperature relation have been performed to test this theoretical relation. However no consensus has been reached with results ranging from substantially lower and higher than 3/2. In this paper, we aim to investigate how this relation changes within modified gravity.
To test this relation, the hydrostatic mass must be constructed using our simulation gas output, which currently consists of pressure p, density ρ, and velocity v.
To compute the hydrostatic mass, one assumes that a galaxy cluster has reached hydrostatic equilibrium expressed as  (17)where G is Newton’s gravitational constant and M(r) is the mass within radius r. Using the ideal gas relation between pressure and temperature Pthermal = kBngasTgas with ρgas = μmpngas, we get the mass within radius r to be
 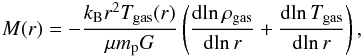 (18)where μ = 0.59 is the mean molecular weight of the gas and kB is the Boltzmann constant.
Experimentally, we can calculate the hydrostatic mass by measuring the temperature and density profiles via X-ray temperature, Sunyaev-Zel’dovich effect and surface-brightness observations (Terukina et al. 2014; Wilcox et al. 2015). Theoretically, one computes the hydrostatic mass in the same way: temperature and density profiles can be directly obtained from our hydrodynamic and N-body simulations for the different modified gravity models.
2.3. The YX mass indicator proxy
An alternative to studying the mass-temperature relation exists in the form of the YX proxy introduced by Kravtsov et al. (2006). The proxy is defined as the product of the spectral temperature and the mass of the gas in a galaxy cluster, 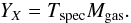 (19)Studies (Kravtsov et al. 2006) show that the YX proxy has a low scatter at high and low redshifts independent of whether the cluster is relaxed or not. In short, the YX might prove a better probe for modified gravity theories, particularly since it is not as sensitive to astrophysical uncertainties as the mass temperature relation.
YX is a function of the spectral temperature, while the simulations contain a gas mass weighted temperature. Vikhlinin et al. (2006) find that it is possible to relate these temperatures to one another by a simple factor of 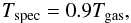 (20)based on observations of 12 galaxy clusters. However a more accurate prescription can be found in Mazzotta et al. (2004)
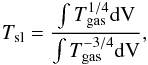 (21)which constructs a spectral-like temperature Tsl by using the gas temperature T within the volume V. This is the temperature we use when constructing the mass indicator proxy YX. Furthermore, we excise the core regions of our clusters by excluding the region within r< 0.10R200c, to reduce the scatter contribution from the central cluster regions.
3. Observations
The observations found in the literature can be categorized as either having well-defined spatial or spectral resolution. Historically there have been very few observations with high spatial resolution (Horner et al. 1999) where the profiles can be directly observed. The majority of the observations need to construct the profiles using analytical and numerical models, with the most common being the isothermal β-model.
There are a large range of studies of the mass-temperature relation (Neumann & Arnaud 1999; Ettori & Fabian 1999; Horner 1999; Nevalainen et al. 2000; Finoguenov et al. 2001; Xu et al. 2001; Shimizu et al. 2003; Vikhlinin et al. 2006; Dai et al. 2007; Vikhlinin et al. 2009; Andersson et al. 2011; Lieu et al. 2016) in the literature, however, not all of these are readily useful. We want to use observations from the last decade, capitalizing on the increased resolution of surveys such as Chandra and XMM. Furthermore the observed quantities have been measured in a wide range of critical densities, with the most common choice being at r500c. We therefore exclude any observations measured at other critical density radii2. Finally, we use only the sources that provide the data in tables, rather than extracting data from figures.
In the end, we chose to work with the data from Vikhlinin et al. (2006, 2009), Andersson et al. (2011), Eckmiller et al. (2011), Lovisari et al. (2015), including observations from both Chandra and XMM-Newton.
4. Simulations
Our code is a modification of the ISIS code (Llinares et al. 2014), which in turn is a modification of the cosmological, hydrodynamic N-body code RAMSES (Teyssier 2002). ISIS implemented the f(R)-gravity and symmetron models to the dark matter component of RAMSES, while the current code extended the modified gravity to also work on the hydrodynamic part of RAMSES.
We run two sets of simulations; one for the symmetron models and one for the f(R)-gravity models. For the sake of consistency with previous work (Hammami et al. 2015; Hammami & Mota 2015), the background cosmology and box size differ in these two sets. Both sets contain 2563 dark matter particles.
For the f(R)-gravity set we have a box size of 200 Mpc/h0, with h0 = 0.7, ΩΛ = 0.727, ΩCDM = 0.227 and Ωb = 0.045. The resulting dark matter particle mass is 3 × 10¹⁰M⊙/h. The simulations were run using the adaptive mash of RAMSES, with eight levels of refinements.
For the symmetron set, we have a box size of 256 Mpc/h0, with h0 = 0.65, ΩΛ = 0.65, ΩCDM = 0.3 and Ωb = 0.05. The resulting dark matter particle mass is 8.32 × 10¹⁰M⊙/h. The simulations were run using the adaptive mash of RAMSES, with six levels of refinements.
The two different cases of the Λ cold dark matter (ΛCDM) model need to be distinguishable in the text. We denote the background ΛCDM model using the symmetron box size and background as ΛCDMS and the one using the f(R)-gravity box size and background as ΛCDMf(R). An overview of the model parameters employed is found in Table 1.
Overview of the model parameters for the symmetron and f(R) models.
The hydrodynamic gas component of the simulations is treated as a simple ideal fluid, not including cooling, star formation, feedback processes etc.
5. Results
Using the Amiga Halo Finder (Knollmann & Knebe 2009), we obtain the location of all the galaxy clusters and their respective r200c. We keep all galaxy clusters that contain at least 1000 dark matter particles to ensure that all clusters we study are well above the resolution limit of our simulations. Generally, this leaves somewhere between 2000 to 3000 clusters per model.
All mass quantities are scaled by the dimensionless Hubble parameter and presented in units of  and the temperature is scaled by the Boltzmann constant kB and presented in units of keV.
Figure 1 shows the raw mass-temperature plot for all the identified galaxy clusters in the ΛCDMS model, the same plot for ΛCDMf(R) is very similar and is not shown.
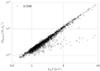 |
Fig. 1 Raw mass-temperature data for ΛCDMS, containing all 2379 identified galaxy clusters. |
The hydrostatic mass and temperature generally follows a near-linear relation in the log-log plot, with a small amount of outliers. The outliers consist of low-mass clusters with very large temperatures and represent galaxy clusters that are highly unrelaxed. An analytical fit to this result would be highly skewed owing to the outliers.
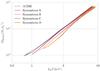 |
Fig. 2 Mass-temperature relation for ΛCDMS and the symmetron models for the stacked galaxy clusters. |
However, the mass-temperature relation using stacked3 masses and temperatures shows no signs of any outliers, which have been suppressed by the stacking process. For the remainder of the paper we discuss the mass-temperature relation constructed from stacked quantities.
In Figs. 2 and 3 we present the mass-temperature relation for the symmetron- and f(R)-gravity models, respectively. The broadening of the lines in the figures represents the standard deviation that is due to the stacking.
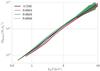 |
Fig. 3 Mass-temperature relation for ΛCDMf(R) and the f(R)-gravity models for the stacked galaxy clusters. |
The massive, hot galaxy clusters, found at the top-right corner of the figures, show that all the models are indistinguishable from one another. However, the smaller, less hot clusters, show that the differences between the models get more pronounced the smaller and colder a cluster is. The differences between the models can clearly be distinguished when studying the smallest and coldest galaxy clusters.
The fifth force makes a galaxy cluster collapse and increase its mass at a faster rate than in standard gravity while, at the same time, increasing the temperature of the galaxy clusters (Hammami & Mota 2015). This might lead to wondering why the modified gravity models show a lower mass at a given temperature than the ΛCDM models. This is in fact a direct effect of demanding hydrostatic equilibrium.
The equilibrium equation, Eq. (17), describes how the pressure gradient, directly proportional to the temperature, is in equilibrium with the gravity of the mass. In the presence of a fifth force, the gravitational constant will be replaced by a gravitational constant of the form Geff = GGR + Gfifth, which amplifies the gravitational effect of the mass.
If we now look at the equilibrium equation for a given temperature, then the pressure gradient will remain constant, the gravitational constant will be replaced by a stronger effective gravitational constant, and the mass of the galaxy cluster needs to decrease for the equilibrium to be upheld. Thus, even though the modified gravity theories increase the mass of galaxy clusters, the mass in the hydrostatic mass-temperature relation will be lower than that of standard gravity.
A consequence of the minimum limit of dark matter particles described earlier is apparent when comparing the modified gravity models to the ΛCDM models. The smallest clusters in the modified gravity models are noticeably larger and hotter than the smallest clusters in the ΛCDM models. In the modified gravity models, the temperature is larger than in ΛCDM (Hammami et al. 2015; Hammami & Mota 2015), resulting in the hydrostatic mass being noticeably larger in modified gravity models than in standard gravity. A comparison of how modified gravity theories affect the various masses (kinetic, lensing and hydrostatic) can be found in Gronke et al. (2016).
Figure 2 shows that the symmetron models deviate from ΛCDM in the order of Sym D > Sym B > Sym C > Sym A, for the medium-to-low mass range. This demonstrates that the mass-temperature relation is more sensitive to the symmetry-breaking criteria aSSB than the strength of the coupling β, similar to what was found in Hammami et al. (2015), Hammami & Mota (2015).
The f(R) models show that the higher the coupling, the larger the deviations, with FofR04 > FofR05 > FofR06. However, unlike the symmetrons, we have a model that is permanently deviating from the ΛCDM value even for the largest clusters, namely that of FofR04. This is, however, not surprising since FofR04 has long been ruled out as a viable candidate. Owing to the smaller box size employed in the f(R) simulations, the largest masses in this set of simulations are smaller than in the symmetron simulation set.
In Figs. 4 and 5 we present observations from the literature as points over-plotted on the previous two figures, for the symmetron and f(R)-gravity models, respectively. The yellow and magenta data points represent the high and low redshift data from Vikhlinin et al. (2009), respectively, while the blue data points are from Vikhlinin et al. (2006).
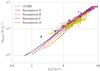 |
Fig. 4 Mass-temperature data for ΛCDMS and the symmetron models, for the stacked galaxy clusters, including observational data points from Vikhlinin et al. (2009; yellow and magenta) and Vikhlinin et al. (2006; blue). |
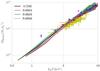 |
Fig. 5 Mass-temperature data for ΛCDMf(R) and the f(R)-gravity models, for the stacked galaxy clusters, including observational data points from Vikhlinin et al. (2009; yellow and magenta) and Vikhlinin et al. (2006; blue). |
The observational data points clearly have a wide spread that encompasses all of our models at the largest masses. At the very lowest masses the observations have a higher value than any of our simulated models, however the number of data points in this region is also low.
Figure 4 shows that all models are consistent with observations at the large mass range, however at the medium-to-low end, we note that the data is only consistent with standard gravity and Sym A. Sym B, Sym C, and Sym D all fall substantially far below the observed data point, a clue that the mass-temperature relation could be a prime candidate for excluding modified gravity models.
Figure 5 show the same behaviour, but here all models remain consistent with observations for a wider mass-range than the symmetrons. First, at temperatures below 1 keV, we can point to FofR04 and FofR05 no longer being consistent with the observations.
In Figs. 6 and 7 we present the proxy mass indicator relation M-YX for the symmetron- and f(R)-gravity models respectively, while also including the observations from the literature. The yellow circles represent the data from Eckmiller et al. (2011) and the magenta triangles are data from Lovisari et al. (2015).
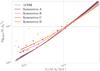 |
Fig. 6 Mass-YX data for ΛCDMS and the symmetron models for the stacked galaxy clusters, including observational data points from Eckmiller et al. (2011; yellow) and Lovisar et al. (2015; magenta). |
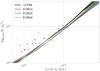 |
Fig. 7 M-YX data for ΛCDMf(R) and the f(R)-gravity models for the stacked galaxy clusters, including observational data points from Eckmiller et al. (2011; yellow) and Lovisar et al. (2015; magenta). |
Studying the mass-YX relation gives us no additional insight in our search for signatures of modified gravity, compared to studying the hydrostatic mass-temperature relation. Models that are easily distinguishable in the mass-YX figures were already distinguishable in the hydrostatic mass-temperature figures, in fact certain models, such as Sym C, is no longer easily distinguishable from ΛCDM. The mass-YX is still, however, an interesting quantity to study owing to the observations being less sensitive to systematics. We note that the modified gravity models for the colder galaxy clusters, T< 3 keV, show a larger value compared to that of ΛCDM in the mass-YX figures where, for the hydrostatic mass-temperature figures, the modified gravity models had a lower value.
The compelling reason for using the mass proxy is that it is easier to observe the mass of the gas than it is to resolve the observables needed to construct the hydrostatic mass, as detailed above. We therefore perform the analysis once more for the mass of the gas. In Figs. 8 and 9 we present the mass-temperature relation for the gas mass instead of the hydrostatic mass, with observations from the same sources as for the mass proxy, as well as from Andersson et al. (2011) as blue data points.
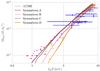 |
Fig. 8 Gas mass-temperature data for ΛCDMS and the symmetron models for the stacked galaxy clusters, including observational data points from Eckmiller et al. (2011; yellow), Lovisar et al. (2015; magenta) and Anderson et al. (2011; blue). |
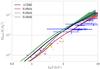 |
Fig. 9 Gas mass-temperature data for ΛCDMf(R) and the f(R)-gravity models for the stacked galaxy clusters, including observational data points from Eckmiller et al. (2011; yellow), Lovisar et al. (2015; magenta) and Anderson et al. (2011; blue). |
The gas mass-temperature relation shows much larger variations between the models than the two previous relations did. For the least massive clusters, we note as much as an order of magnitude difference between ΛCDMS and Sym D. Other than the magnitude of the deviations, the models deviate in the same order as before.
The gas mass-temperature relation seems to be much more sensitive to the effects of the modified gravity theories than the hydrostatic mass-temperature and the mass-proxy relations. This is due to the fact that the mass of the gas is less affected by the fifth force than the total mass and the temperature of galaxy clusters, owing to an environmental screening (Hammami et al. 2015; Hammami & Mota 2015).
The fifth force will cause the dark matter and gas of a galaxy cluster to cluster at a faster rate than in standard gravity, however, owing to the collisionless nature of dark matter; the dark matter collapses at a much faster rate than the gas. This in turn means that the screening mechanism, which is dependent on the total density environment, is activated so that not as much additional gas was added to a galaxy cluster, compared to the amount of additional dark matter. While the fifth force increases the temperature of the galaxies, the same for the total hydrostatic mass-temperature relation and the gas mass-temperature relation, the amount of additional mass is much lower in the gas mass than in the hydrostatic mass.
5.1. Analytical fit
Theory predicts that the hydrostatic mass and temperature should follow a power-law function of the form of Eq. (16). It is therefore interesting to see if we can fit a power-law relation between the mass and temperature to our simulation results.
We perform a non-linear least squares fit, using the Levenberg-Marquardt algorithm (Levenberg 1944), through the SciPy Python package (Jones et al. 2001) to fit the data with a power law function  (22)The fit analysis is run on the mass-temperature relation using the stacked galaxy clusters, to avoid skewing the results with the outliers. The results for b and its corresponding standard deviations are presented in Table 2.
Result from fitting a power law to our simulated mass-temperature relation.
We note that our ΛCDM slopes are steeper than the predicted slope of 3/2, however this behaviour is known from previous N-body simulations (Fabjan et al. 2011).
The largest deviations from the ΛCDM fits are found in the models Sym D and FofR05, while only FofR04 and FofR06 are consistent with ΛCDMf(R).
The symmetron best fits follow a pattern of an increasing exponent and decreasing amplitude for a decreasing symmetry breaking criteria. With only one model with a coupling other than unity, as of now, we cannot discern the effect the strength of the coupling has on the best fit. We can estimate a mass-temperature relation correlated with the symmetry breaking criteria aSSBf as  (23)This relation assumes that β = 1. The relation proves to have a 2.4% accuracy in the amplitude and a 0.3% accuracy in the exponent. Inserting aSSB = a0 = 1 into the relation above, we find that the lower limit power law for the symmetron model is T1.6 for models where λ0 = 1 and β = 1.
We are unable to find a direct correlation between the power and value of fR0, however the amplitude increases with a decreasing fR0. For both FofR04 and FofR06, the exponent is consistent with ΛCDMf(R), with FofR05 having a greater power. By assuming that the power of FofR05 is an anomoly and that the power of the f(R) mass-temperature relation is the same as in ΛCDMf(R), we can construct a relation between fR0 and the amplitude as 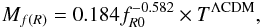 (24)with 5% accuracy.
5.2. Universal and non-universal coupling
In our previous work (Hammami & Mota 2015), we studied the effect of having two different couplings to matter; one for baryons βgas and one for dark matter βDM. We repeat part of the analysis above for the Sym B model, but with a wide range of various coupling combinations now, as shown in Table 3.
Various couplings based on the Sym B model.
Our hope is to find some signature that can distinguish models with universal coupling from models with non-universal coupling. If it was possible to find traces of a non-universal coupling in observations, this would essentially be a breaking of the equivalence principle.
In Fig. 10, we present the hydrostatic mass-temperature relation, the mass-YX relation, and gas mass-temperature relation for both the universal and non-universal models.
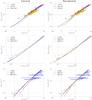 |
Fig. 10 Top panels: hydrostatic mass-temperature ratio, middle panels: mass-YX relation, and bottom panels: gas mass-temperature relation for universally and non-universally coupled models, respectively. The obervational data points in the top row are taken from Vikhlinin et al. (2009; yellow and magenta) and Vikhlinin et al. (2006; blue), while the data points in the middle and bottom row are taken from Eckmiller et al. (2011; yellow), Lovisar et al. (2015; magenta) and Anderson et al. (2011; blue). |
Once again, we see that we have a hard time distinguishing the models when studying the mass-YX relation, a better time distinguishing models for the hydrostatic mass-temperature relation, and a very easy time distinguishing models in the gas mass-temperature relation.
Models where the gas is minimally coupled to the scalar field show very little deviations from the standard gravity mass-temperature relation. This effect is seen in all three types of mass-temperature relations. This finding is in agreement with results in Hammami & Mota (2015), where we noted that deviations in the temperature profiles were not noticeably different from standard gravity for a minimally coupled gas. Since all the mass estimates above use either the gas or the temperature to estimate the mass, a minimally coupled gas results in a mass that is also indistinguishable from the mass in standard gravity. No signatures that can identify universal coupling from non-universal coupling can be found.
6. Conclusions
In this paper we have shown, by using non-radiative hydrodynamic cosmological simulations, that the mass-temperature relation can be a prime candidate for testing modified gravity theories against observations, with the mass of the gas, rather than the total hydrostatic mass, being the mass quantity that shows strongest signatures of modified gravity theories.
The strength of studying the mass-temperature relation lies in the fact that the modified gravity models can easily be distinguished from the ΛCDM reference values, masses below M = 5 × 10¹⁴M⊙h-1, and temperatures below kBT = 1 keV, the best-fit analysis returns a power law very unlike the theoretical M ∝ T3/2. A framework for observing the mass-temperature relation already exists and large quantities of data are available.
Unfortunately the amount of observations available in this mass-temperature range is sparse, with the majority of the observations being for massive, hot galaxy clusters where all models are indistinguishable from one another. However with major surveys, such as Chandra and XMM-Newton, the data is available, and only needs to be assembled.
Alternatives to the standard hydrostatic mass-temperature relation were explored by using the mass proxy YX, as well as the mass of the gas directly. Both of these suffer less observational systematics than the hydrostatic mass observations since the gas can be directly observed. The mass proxy, unfortunately, diminished the deviations that would have allowed us to easily distinguish the models. With the gas mass-temperature relation, however, the models could be distinguished to an even greater degree. We therefore propose that the gas mass-temperature relation can be an even stronger candidate than the standard hydrostatic mass-temperature relation.
We have shown that, for the symmetron models, the hydrostatic mass-temperature relation is strongly sensitive to the symmetry-breaking criteria aSSB with a smaller dependency on the strength of the coupling to the scalar field. The analytical fit for the symmetron models also showed a high sensitivity to the symmetry-breaking criteria, and we constructed a mass-temperature relation with aSSB as an input parameter for all symmetron models with a coupling factor β = 1. While the power of the f(R) hydrostatic mass-temperature relations did not appear to follow any relation to the choice of fR0, we are able to present a relation for the amplitude of the hydrostatic mass-temperature relation and the input parameter fR0.
Numerous pitfalls still exist for using the hydrostatic mass-temperature relation as a primer on modified gravity theories, such as the assumption that galaxy clusters are in hydrostatic equilibrium, the number of assumptions related to observational astronomy, and numerical uncertainties. However, equipped with the information presented in this paper, a renewed focus on studying and understanding the mass-temperature relation in future studies seems warranted, particularly with a focus on the gas mass-temperature relation that does not require an assumption of hydrostatic equilibrium.
Furthermore, if the gas is minimally coupled to the scalar field then the temperature of the gas is unchanged and, therefore, the mass shows no deviations from general relativity. This means that, even if the dark matter is coupled to the scalar field, the mass-temperature relation may still be indistinguishable from standard gravity. The mass-temperature relation is thus a poor probe of gravity for models where the baryons are minimally coupled to the scalar field.
r200c is defined as the radius where the density of a galaxy cluster is 200 times the critical density of the Universe and is generally thought to be the point where the halo is fully virialized and at hydrostatic equilibrium.
Methods exist for converting one set of rΔc to any other value (Shimizu et al. 2003), however it requires having a model for the density profile, a restriction we would prefer not to impose on our comparisons. For our analysis we used the approximation R500c ~ 0.63R200c.
We stack the quantities in mass bins and then calculate the average. The bins are chosen so that the largest bin has a minimum of 15 clusters, the remaining bins contain hundreds of clusters
Acknowledgments
The authors thank The Research Council of Norway for funding and the NOTUR facilities for computational resources.
References
- Andersson, K., Benson, B. A., Ade, P. A. R., et al. 2011, ApJ, 738, 48 [NASA ADS] [CrossRef] [Google Scholar]
- Arnold, C., Puchwein, E., & Springel, V. 2014, MNRAS, 440, 833 [NASA ADS] [CrossRef] [Google Scholar]
- Bertotti, B., Iess, L., & Tortora, P. 2003, Nature, 425, 374 [NASA ADS] [CrossRef] [PubMed] [Google Scholar]
- Brans, C., & Dicke, R. H. 1961, Phys. Rev., 124, 925 [NASA ADS] [CrossRef] [MathSciNet] [Google Scholar]
- Brax, P., Davis, A.-C., Li, B., & Winther, H. A. 2012, Phys. Rev. D, 86, 044015 [NASA ADS] [CrossRef] [Google Scholar]
- Brax, P., Davis, A.-C., Li, B., Winther, H. A., & Zhao, G.-B. 2013, J. Cosmol. Astropart. Phys., 4, 29 [Google Scholar]
- Clifton, T., Ferreira, P. G., Padilla, A., & Skordis, C. 2012, Phys. Rep., 513, 1 [NASA ADS] [CrossRef] [MathSciNet] [Google Scholar]
- Dai, X., Kochanek, C. S., & Morgan, N. D. 2007, ApJ, 658, 917 [NASA ADS] [CrossRef] [Google Scholar]
- de Felice, A., & Tsujikawa, S. 2010, Liv. Rev. Rel., 13, 3 [NASA ADS] [CrossRef] [Google Scholar]
- Del Popolo, A. 2002, MNRAS, 336, 81 [NASA ADS] [CrossRef] [Google Scholar]
- Dimopoulos, S., Graham, P. W., Hogan, J. M., & Kasevich, M. A. 2007, Phys. Rev. Lett., 98, 111102 [NASA ADS] [CrossRef] [PubMed] [Google Scholar]
- Eckmiller, H. J., Hudson, D. S., & Reiprich, T. H. 2011, A&A, 535, A105 [NASA ADS] [CrossRef] [EDP Sciences] [Google Scholar]
- Ettori, S., & Fabian, A. C. 1999, MNRAS, 305, 834 [NASA ADS] [CrossRef] [Google Scholar]
- Everitt, C. W. F., Debra, D. B., Parkinson, B. W., et al. 2011, Phys. Rev. Lett., 106, 221101 [Google Scholar]
- Fabjan, D., Borgani, S., Rasia, E., et al. 2011, MNRAS, 416, 801 [NASA ADS] [CrossRef] [Google Scholar]
- Finoguenov, A., Reiprich, T. H., & Böhringer, H. 2001, A&A, 368, 749 [NASA ADS] [CrossRef] [EDP Sciences] [Google Scholar]
- Frieman, J. A., Turner, M. S., & Huterer, D. 2008, ARA&A, 46, 385 [NASA ADS] [CrossRef] [Google Scholar]
- Gronke, M. B., Llinares, C., & Mota, D. F. 2014, A&A, 562, A9 [NASA ADS] [CrossRef] [EDP Sciences] [Google Scholar]
- Gronke, M., Hammami, A., Mota, D. F., & Winther, H. A. 2016, A&A, 595, A78 [NASA ADS] [CrossRef] [EDP Sciences] [Google Scholar]
- Hammami, A., & Mota, D. F. 2015, A&A, 584, A57 [NASA ADS] [CrossRef] [EDP Sciences] [Google Scholar]
- Hammami, A., Llinares, C., Mota, D. F., & Winther, H. A. 2015, MNRAS, 449, 3635 [NASA ADS] [CrossRef] [Google Scholar]
- Hinterbichler, K., & Khoury, J. 2010, Phys. Rev. Lett., 104, 231301 [NASA ADS] [CrossRef] [Google Scholar]
- Horner, D. 1999, BAAS, 31, 1551 [NASA ADS] [Google Scholar]
- Horner, D. J., Mushotzky, R. F., & Scharf, C. A. 1999, ApJ, 520, 78 [NASA ADS] [CrossRef] [Google Scholar]
- Hoyle, C. D., Kapner, D. J., Heckel, B. R., et al. 2004, Phys. Rev. D, 70, 042004 [NASA ADS] [CrossRef] [MathSciNet] [Google Scholar]
- Hu, W., & Sawicki, I. 2007, Phys. Rev. D, 76, 064004 [CrossRef] [Google Scholar]
- Jones, E., Oliphant, T., Peterson, P., et al. 2001, SciPy: Open source scientific tools for Python (online, accessed 2016-02-01) [Google Scholar]
- Khoury, J. 2010, ArXiv e-prints [arXiv:1011.5909] [Google Scholar]
- Khoury, J., & Weltman, A. 2004, Phys. Rev. D, 69, 044026 [CrossRef] [Google Scholar]
- Knollmann, S. R., & Knebe, A. 2009, ApJS, 182, 608 [NASA ADS] [CrossRef] [Google Scholar]
- Kravtsov, A. V., Vikhlinin, A., & Nagai, D. 2006, ApJ, 650, 128 [NASA ADS] [CrossRef] [Google Scholar]
- Levenberg, K. 1944, Quarterly Appl. Math., 2, 164 [Google Scholar]
- Li, B., Mota, D. F., & Barrow, J. D. 2011, ApJ, 728, 109 [NASA ADS] [CrossRef] [Google Scholar]
- Li, B., Zhao, G.-B., Teyssier, R., & Koyama, K. 2012, J. Cosmol. Astropart. Phys., 1, 51 [Google Scholar]
- Li, B., Zhao, G.-B., & Koyama, K. 2013, J. Cosmol. Astropart. Phys., 5, 23 [NASA ADS] [CrossRef] [Google Scholar]
- Li, B., He, J.-H., & Gao, L. 2016, MNRAS, 456, 146 [NASA ADS] [CrossRef] [Google Scholar]
- Lieu, M., Smith, G. P., Giles, P. A., et al. 2016, A&A, 592, A4 [NASA ADS] [CrossRef] [EDP Sciences] [Google Scholar]
- Lilje, P. B. 1992, ApJ, 386, L33 [NASA ADS] [CrossRef] [Google Scholar]
- Llinares, C., & Mota, D. F. 2014, Phys. Rev. D, 89, 084023 [NASA ADS] [CrossRef] [Google Scholar]
- Llinares, C., Knebe, A., & Zhao, H. 2008, MNRAS, 391, 1778 [NASA ADS] [CrossRef] [Google Scholar]
- Llinares, C., Mota, D. F., & Winther, H. A. 2014, A&A, 562, A78 [NASA ADS] [CrossRef] [EDP Sciences] [Google Scholar]
- Lovisari, L., Reiprich, T. H., & Schellenberger, G. 2015, A&A, 573, A118 [NASA ADS] [CrossRef] [EDP Sciences] [Google Scholar]
- Mazzotta, P., Rasia, E., Moscardini, L., & Tormen, G. 2004, MNRAS, 354, 10 [NASA ADS] [CrossRef] [Google Scholar]
- Neumann, D. M., & Arnaud, M. 1999, A&A, 348, 711 [NASA ADS] [Google Scholar]
- Nevalainen, J., Markevitch, M., & Forman, W. 2000, ApJ, 532, 694 [NASA ADS] [CrossRef] [Google Scholar]
- Oyaizu, H. 2008, Phys. Rev. D, 78, 123523 [NASA ADS] [CrossRef] [Google Scholar]
- Planelles, S., Borgani, S., Fabjan, D., et al. 2014, MNRAS, 438, 195 [NASA ADS] [CrossRef] [Google Scholar]
- Puchwein, E., Baldi, M., & Springel, V. 2013, MNRAS, 436, 348 [NASA ADS] [CrossRef] [Google Scholar]
- Riess, A. G., Filippenko, A. V., Challis, P., et al. 1998, AJ, 116, 1009 [NASA ADS] [CrossRef] [Google Scholar]
- Shimizu, M., Kitayama, T., Sasaki, S., & Suto, Y. 2003, ApJ, 590, 197 [NASA ADS] [CrossRef] [Google Scholar]
- Stanek, R., Rasia, E., Evrard, A. E., Pearce, F., & Gazzola, L. 2010, ApJ, 715, 1508 [NASA ADS] [CrossRef] [Google Scholar]
- Terukina, A., Lombriser, L., Yamamoto, K., et al. 2014, J. Cosmol. Astropart. Phys., 4, 13 [Google Scholar]
- Teyssier, R. 2002, A&A, 385, 337 [NASA ADS] [CrossRef] [EDP Sciences] [Google Scholar]
- Vikhlinin, A., Kravtsov, A., Forman, W., et al. 2006, ApJ, 640, 691 [NASA ADS] [CrossRef] [Google Scholar]
- Vikhlinin, A., Burenin, R. A., Ebeling, H., et al. 2009, ApJ, 692, 1033 [NASA ADS] [CrossRef] [Google Scholar]
- Wilcox, H., Bacon, D., Nichol, R. C., et al. 2015, MNRAS, 452, 1171 [NASA ADS] [CrossRef] [Google Scholar]
- Winther, H. A., Mota, D. F., & Li, B. 2012, ApJ, 756, 166 [NASA ADS] [CrossRef] [Google Scholar]
- Xu, H., Jin, G., & Wu, X.-P. 2001, ApJ, 553, 78 [NASA ADS] [CrossRef] [Google Scholar]
- Zhao, G.-B., Li, B., & Koyama, K. 2011, Phys. Rev. D, 83, 044007 [NASA ADS] [CrossRef] [Google Scholar]
All Tables
All Figures
|
Fig. 1 Raw mass-temperature data for ΛCDMS, containing all 2379 identified galaxy clusters. |
| In the text | |
|
Fig. 2 Mass-temperature relation for ΛCDMS and the symmetron models for the stacked galaxy clusters. |
| In the text | |
|
Fig. 3 Mass-temperature relation for ΛCDMf(R) and the f(R)-gravity models for the stacked galaxy clusters. |
| In the text | |
|
Fig. 4 Mass-temperature data for ΛCDMS and the symmetron models, for the stacked galaxy clusters, including observational data points from Vikhlinin et al. (2009; yellow and magenta) and Vikhlinin et al. (2006; blue). |
| In the text | |
|
Fig. 5 Mass-temperature data for ΛCDMf(R) and the f(R)-gravity models, for the stacked galaxy clusters, including observational data points from Vikhlinin et al. (2009; yellow and magenta) and Vikhlinin et al. (2006; blue). |
| In the text | |
|
Fig. 6 Mass-YX data for ΛCDMS and the symmetron models for the stacked galaxy clusters, including observational data points from Eckmiller et al. (2011; yellow) and Lovisar et al. (2015; magenta). |
| In the text | |
|
Fig. 7 M-YX data for ΛCDMf(R) and the f(R)-gravity models for the stacked galaxy clusters, including observational data points from Eckmiller et al. (2011; yellow) and Lovisar et al. (2015; magenta). |
| In the text | |
|
Fig. 8 Gas mass-temperature data for ΛCDMS and the symmetron models for the stacked galaxy clusters, including observational data points from Eckmiller et al. (2011; yellow), Lovisar et al. (2015; magenta) and Anderson et al. (2011; blue). |
| In the text | |
|
Fig. 9 Gas mass-temperature data for ΛCDMf(R) and the f(R)-gravity models for the stacked galaxy clusters, including observational data points from Eckmiller et al. (2011; yellow), Lovisar et al. (2015; magenta) and Anderson et al. (2011; blue). |
| In the text | |
|
Fig. 10 Top panels: hydrostatic mass-temperature ratio, middle panels: mass-YX relation, and bottom panels: gas mass-temperature relation for universally and non-universally coupled models, respectively. The obervational data points in the top row are taken from Vikhlinin et al. (2009; yellow and magenta) and Vikhlinin et al. (2006; blue), while the data points in the middle and bottom row are taken from Eckmiller et al. (2011; yellow), Lovisar et al. (2015; magenta) and Anderson et al. (2011; blue). |
| In the text | |
Current usage metrics show cumulative count of Article Views (full-text article views including HTML views, PDF and ePub downloads, according to the available data) and Abstracts Views on Vision4Press platform.
Data correspond to usage on the plateform after 2015. The current usage metrics is available 48-96 hours after online publication and is updated daily on week days.
Initial download of the metrics may take a while.