Fig. 8
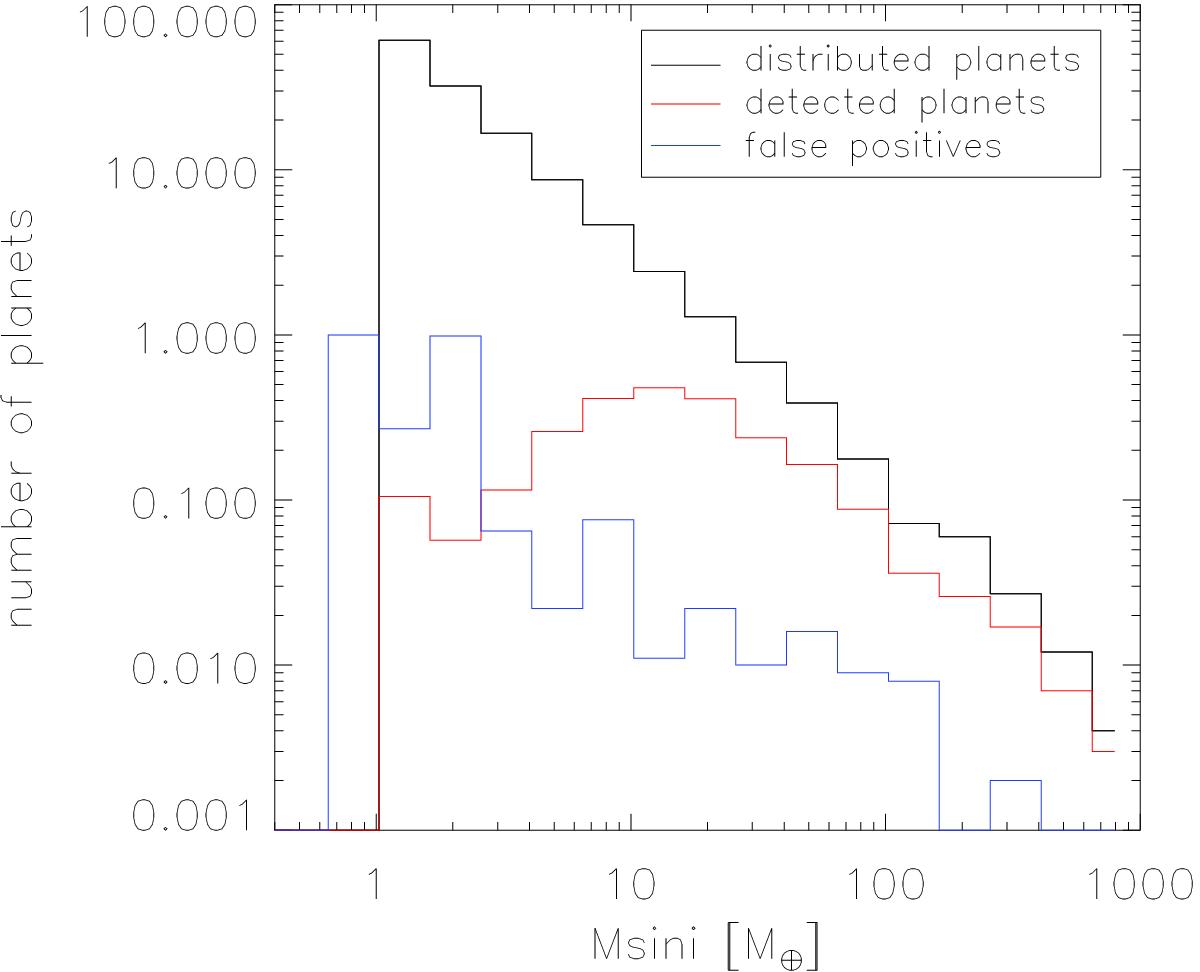
Histogram of minimum masses of the distributed planets around our 78 targets (black line). The red curve indicates the respective distribution of detected planets in our simulation comparable to the observations, and the blue line shows the false positives. Errors are in the order of (0.97NP)0.5 for all planets, (1.00NP)0.5 for the detected ones, and (0.79NP)0.5 for the false positives, respectively, NP is the number of planets.
Current usage metrics show cumulative count of Article Views (full-text article views including HTML views, PDF and ePub downloads, according to the available data) and Abstracts Views on Vision4Press platform.
Data correspond to usage on the plateform after 2015. The current usage metrics is available 48-96 hours after online publication and is updated daily on week days.
Initial download of the metrics may take a while.