Fig. 7
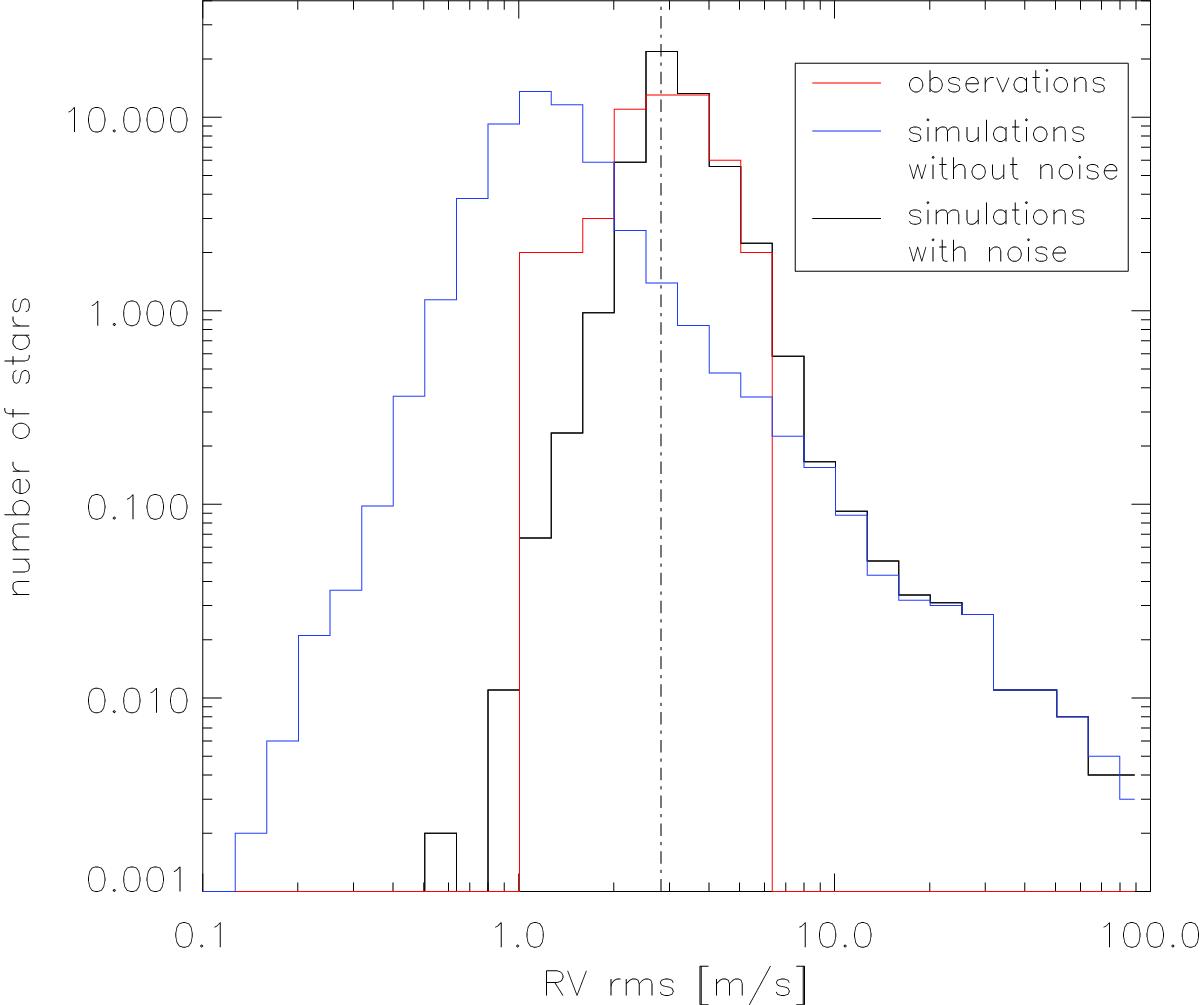
Histogram of RV rms for 52 stars with more than five observations and a 3σ-clipping of the RV rms using observations (red), initial (blue) and final (black) simulations. The initial RV rms distribution does not include any activity jitter, whereas the final distribution includes it by quadratically adding the RV rms as observed for each individual target. For the simulations, we have uncertainties of the histogram values in the order of (0.92NS)0.5 and (0.94NS)0.5 for the black and blue curve. respectively, with NS being the number of stars. They are not shown for reason of clarity.
Current usage metrics show cumulative count of Article Views (full-text article views including HTML views, PDF and ePub downloads, according to the available data) and Abstracts Views on Vision4Press platform.
Data correspond to usage on the plateform after 2015. The current usage metrics is available 48-96 hours after online publication and is updated daily on week days.
Initial download of the metrics may take a while.