Fig. 6
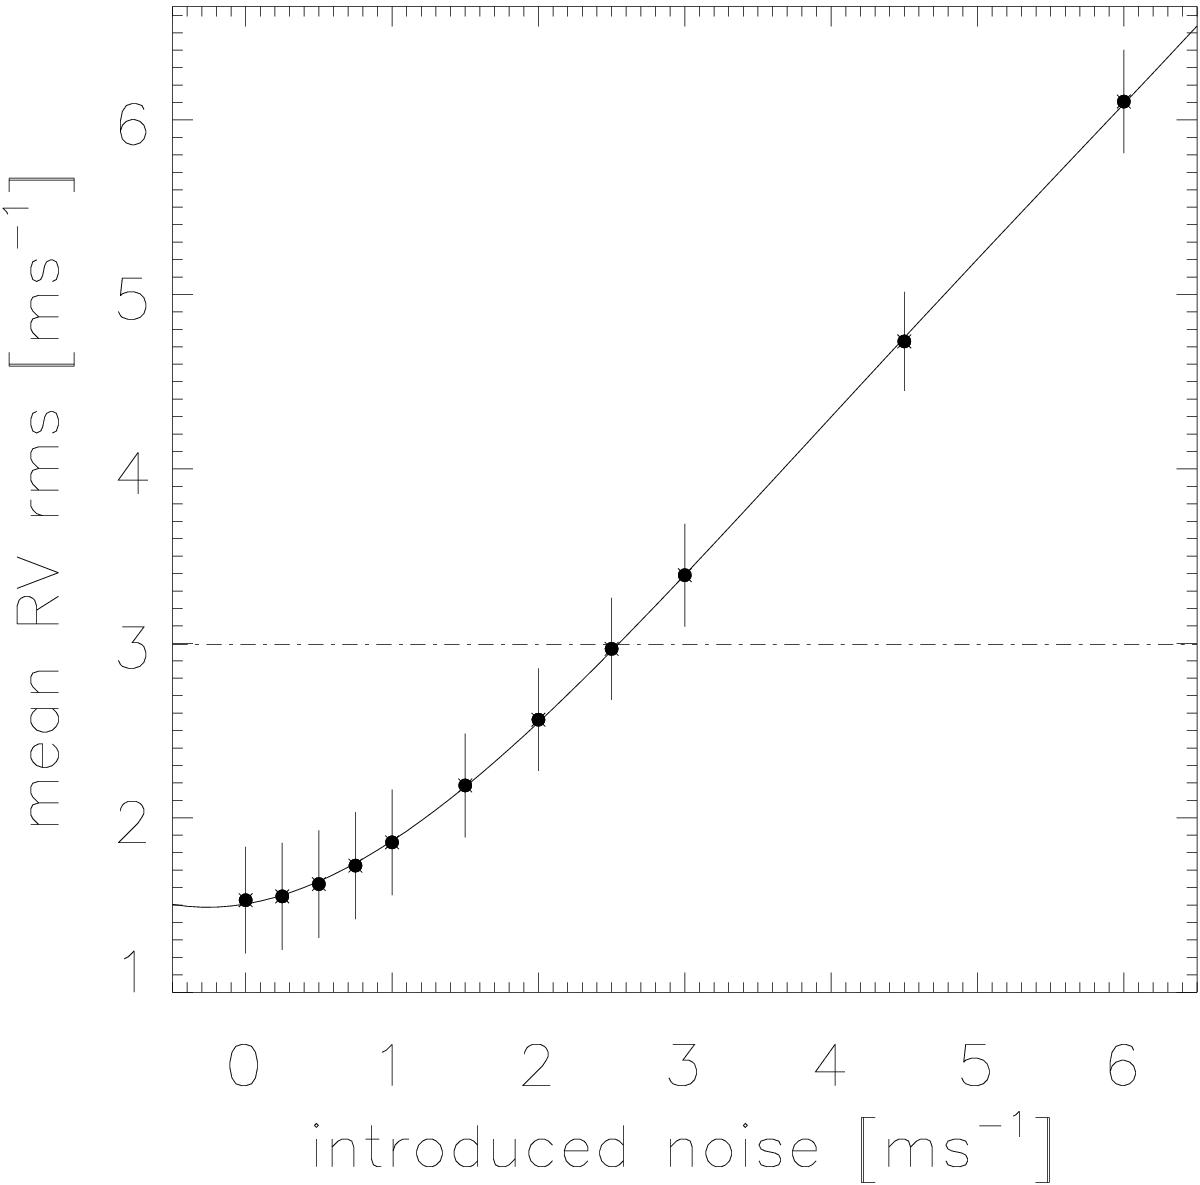
Relationship between the additional white noise introduced quadratically in the simulated RV values and the resulting RV rms for 52 target stars. The dots indicate the probed values, whereas the full drawn line is the best polynomial fit. The dashed dotted line indicates the mean observed value (without correlated activity jitter) of 3.0 m s-1.
Current usage metrics show cumulative count of Article Views (full-text article views including HTML views, PDF and ePub downloads, according to the available data) and Abstracts Views on Vision4Press platform.
Data correspond to usage on the plateform after 2015. The current usage metrics is available 48-96 hours after online publication and is updated daily on week days.
Initial download of the metrics may take a while.