Fig. 4
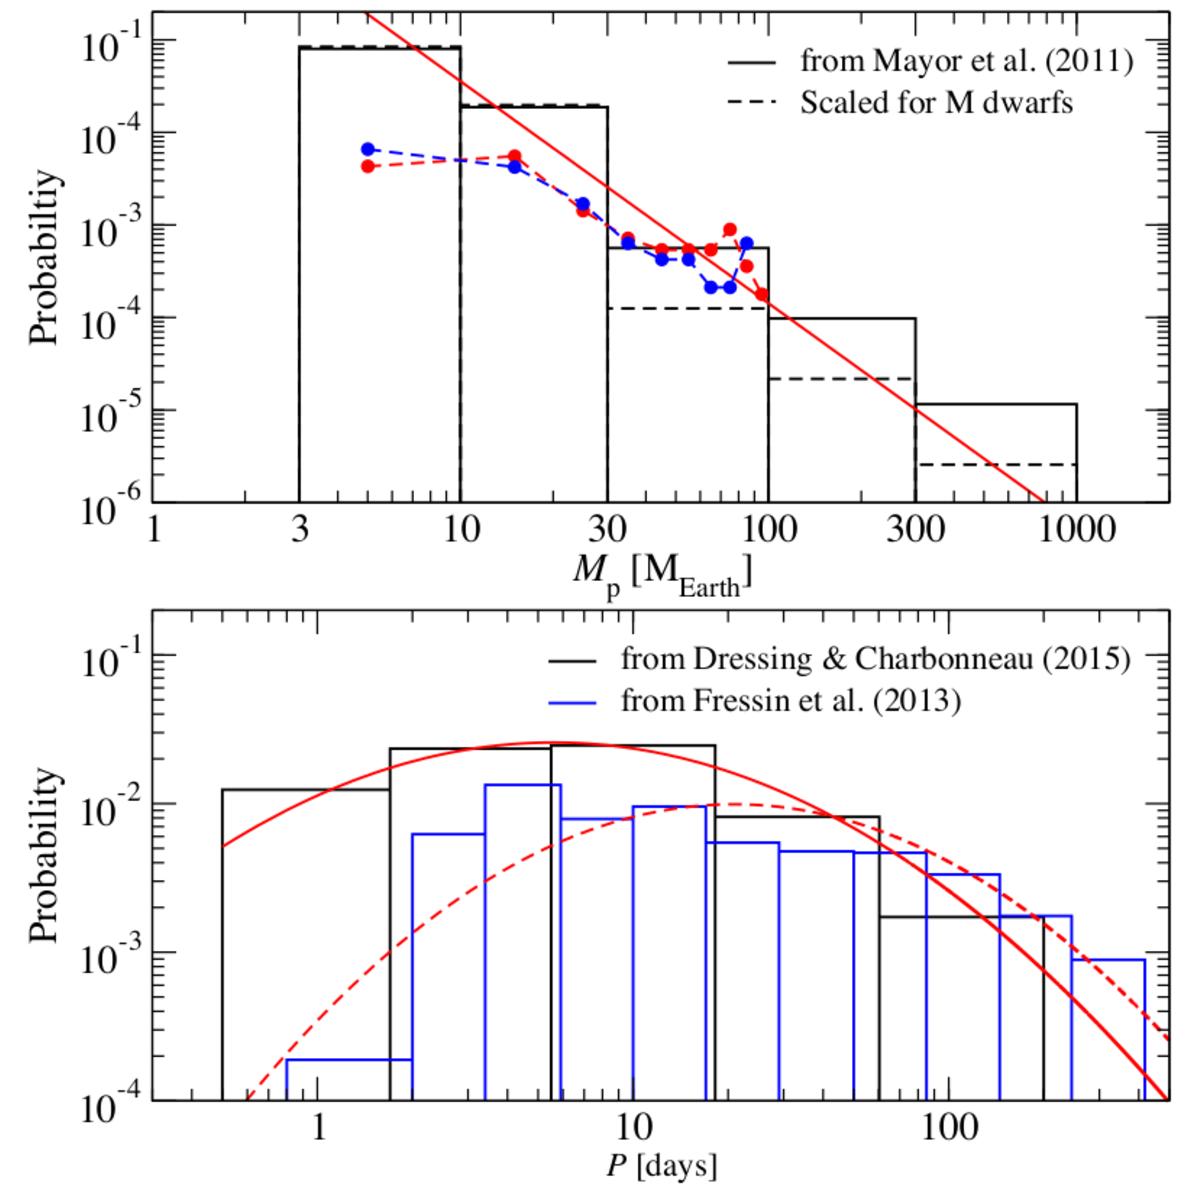
Top: planet mass distribution assumed for our simulations. Solid bars show the probability distribution computed from planet rates given by Mayor et al. (2011). Dashed bars show the scaled distribution for M dwarf host stars following the exoplanet statistics from Dressing & Charbonneau (2013). Our fit to this scaled distribution is plotted in red. These distributions are normalized between 3 and 1000 M⊕. We show the distribution of minimum masses of the 155 planets from Mayor et al. (2011, dashed red line and dots), and the 81 theoretical solutions from Bo13 (dashed blue line and dots).Bottom: orbital period distributions corresponding to planet rates in Fressin et al. (2013, blue) and Dressing & Charbonneau (2015, black) used for planets with masses above and below 30 M⊕, respectively. Solid and dashed red lines indicate the functional fits to these normalized distributions.
Current usage metrics show cumulative count of Article Views (full-text article views including HTML views, PDF and ePub downloads, according to the available data) and Abstracts Views on Vision4Press platform.
Data correspond to usage on the plateform after 2015. The current usage metrics is available 48-96 hours after online publication and is updated daily on week days.
Initial download of the metrics may take a while.