Free Access
Fig. 3
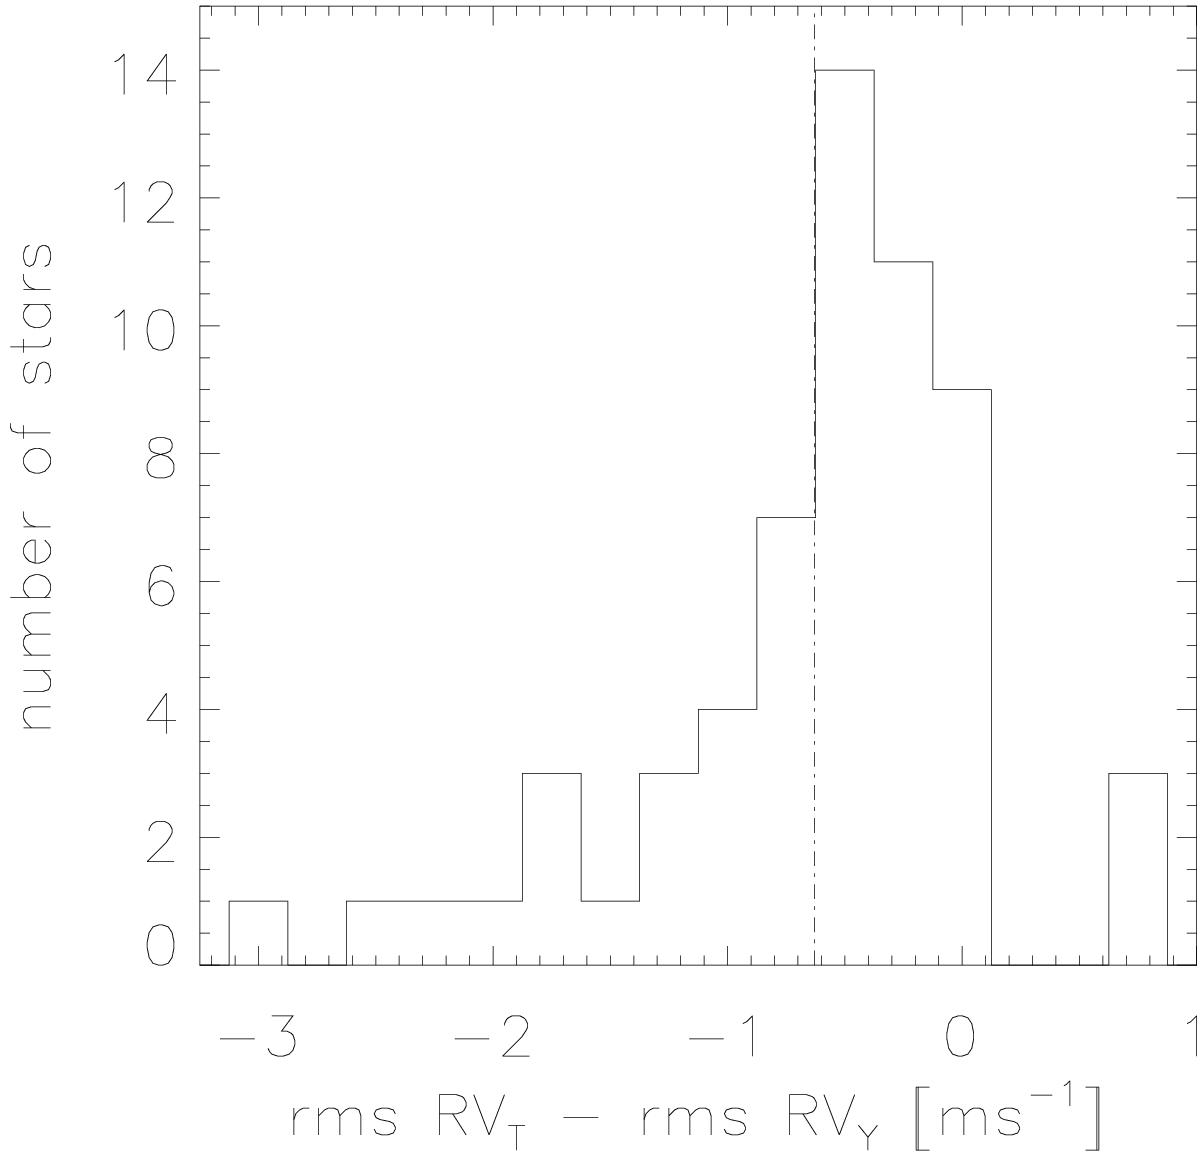
Distribution of RV rms differences from TERRA and YABI for 62 targets. The mean value of −0.63 m s-1 is indicated by the dash-dotted line. Note that two and one outliers are not shown on the left and right extreme ends of the diagram, respectively (see Table A.1).
Current usage metrics show cumulative count of Article Views (full-text article views including HTML views, PDF and ePub downloads, according to the available data) and Abstracts Views on Vision4Press platform.
Data correspond to usage on the plateform after 2015. The current usage metrics is available 48-96 hours after online publication and is updated daily on week days.
Initial download of the metrics may take a while.