Fig. 13
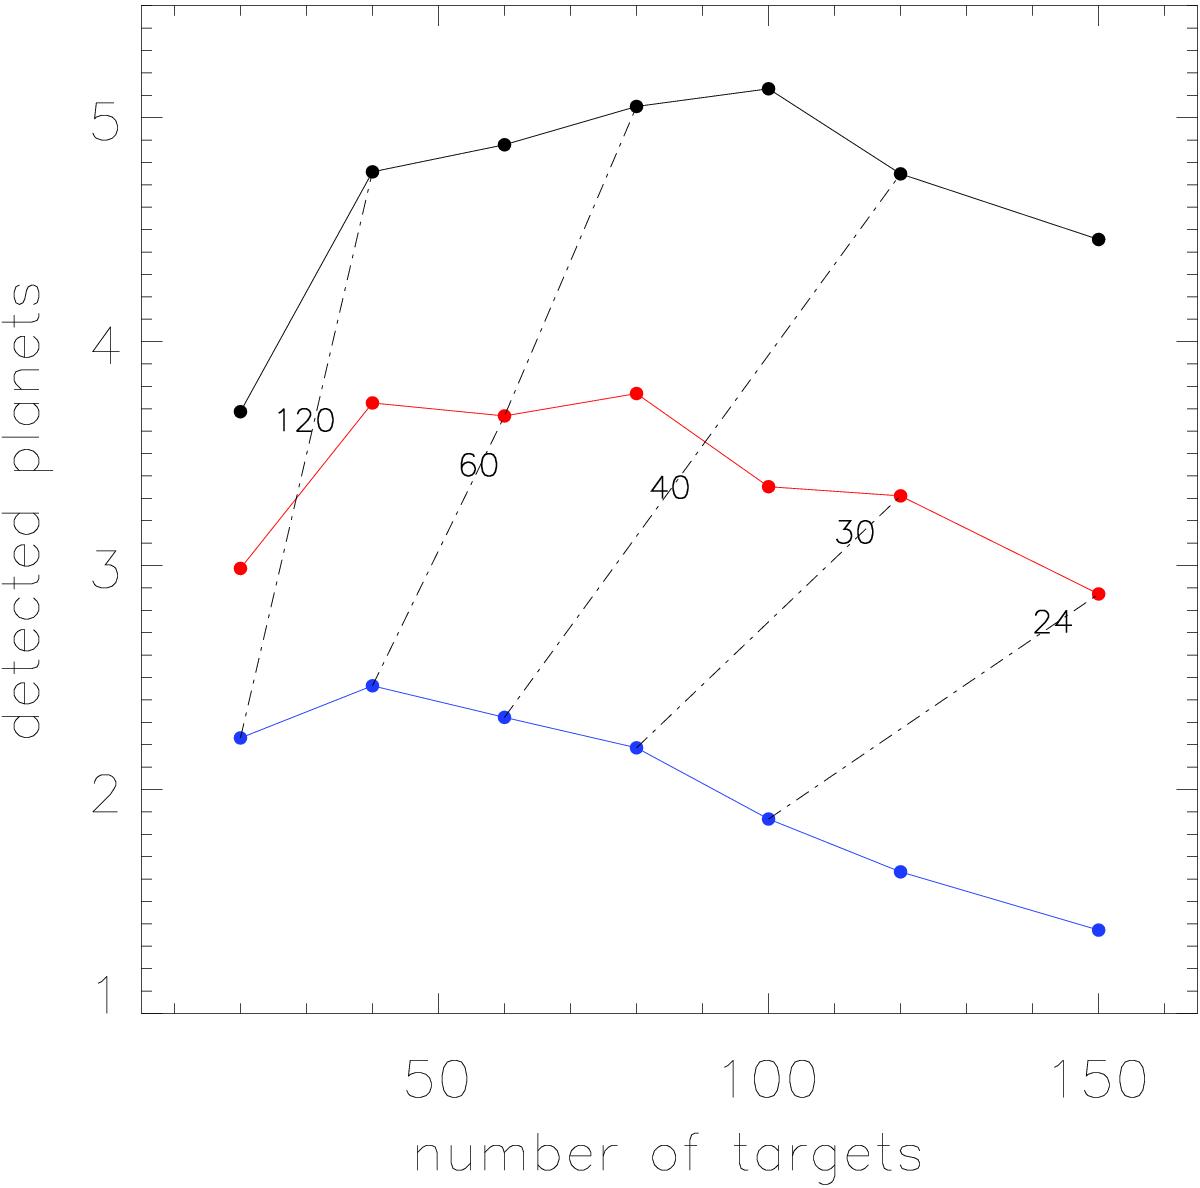
Relationship between the number of detected planets of our simulations and the number of stars used for the survey. For a given total observation time of 800 (blue), 1200 (red) and 1600 h (black) we simulated 20 to 150 stars with 16 to 240 observations per star following Table 1. In the diagram, we connect points with the same number of observations per star using dash-dotted lines. Uncertainties are in the order of 1.4, 1.8, and 2.1 planets for the blue, red and black curves, respectively.
Current usage metrics show cumulative count of Article Views (full-text article views including HTML views, PDF and ePub downloads, according to the available data) and Abstracts Views on Vision4Press platform.
Data correspond to usage on the plateform after 2015. The current usage metrics is available 48-96 hours after online publication and is updated daily on week days.
Initial download of the metrics may take a while.