Fig. 11
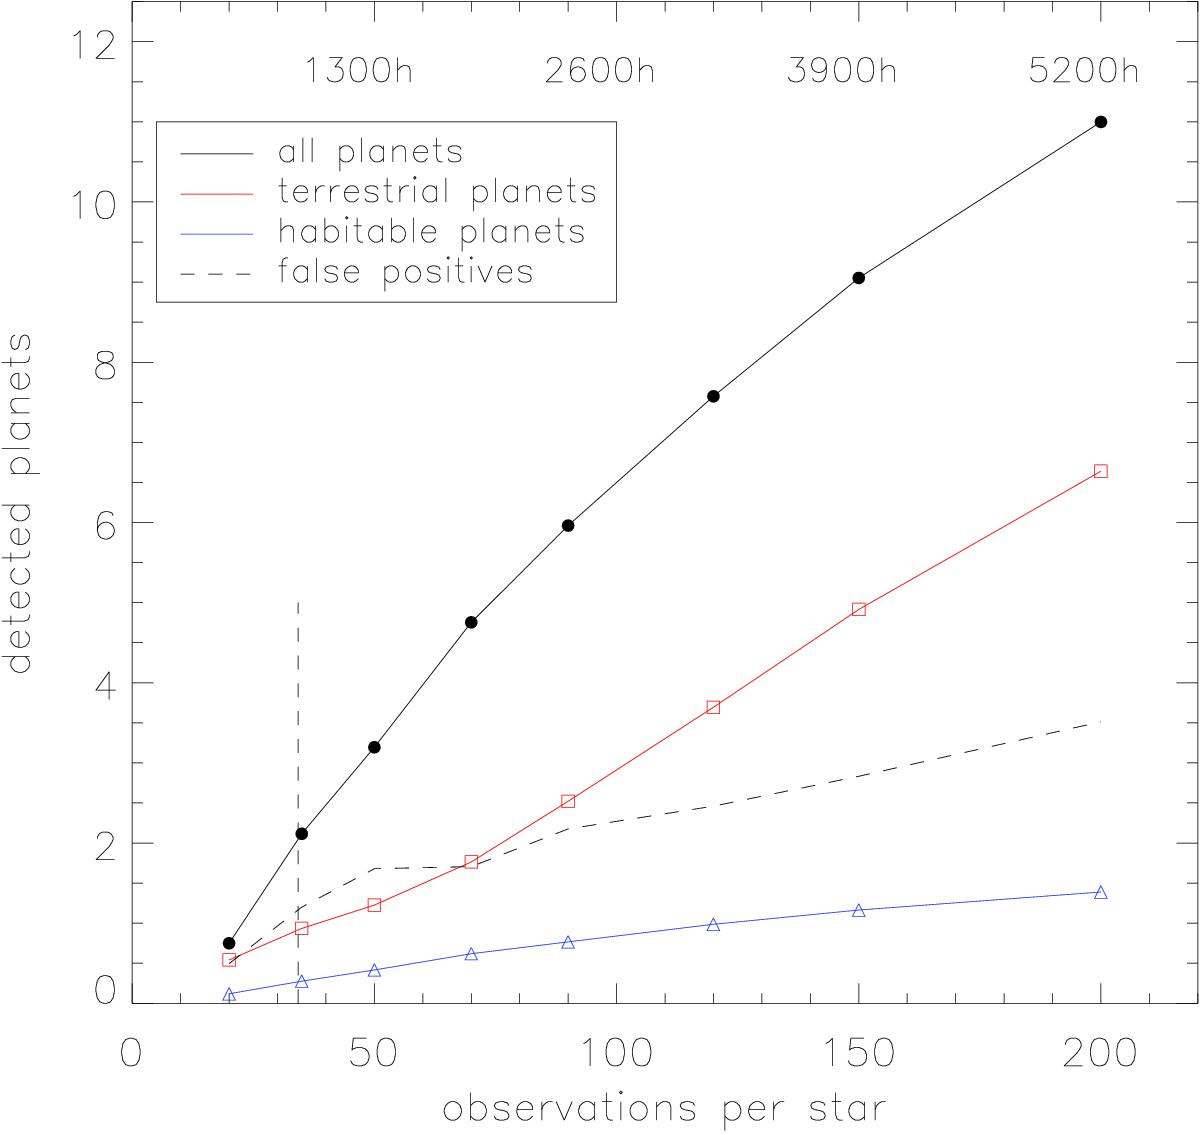
Relationship between the amount of all detected planets and the number of observations per star for the 78 sample stars (black dots, uncertainty (0.92NP)0.5), of the terrestrial planets (red squares, (0.62NP)0.5), the habitable planets (blue triangles, (0.95NP)0.5) and the false positives (black dashed line, (1.17NP)0.5). We indicate at the top the number of total observation times. With the 891 h total observation time and 34.3 observations per star on average of our survey (vertical black dashed line). We detect approximately 2.1 planets resembling the detection rate for evenly distributed 35 observations per star.
Current usage metrics show cumulative count of Article Views (full-text article views including HTML views, PDF and ePub downloads, according to the available data) and Abstracts Views on Vision4Press platform.
Data correspond to usage on the plateform after 2015. The current usage metrics is available 48-96 hours after online publication and is updated daily on week days.
Initial download of the metrics may take a while.