Fig. 10
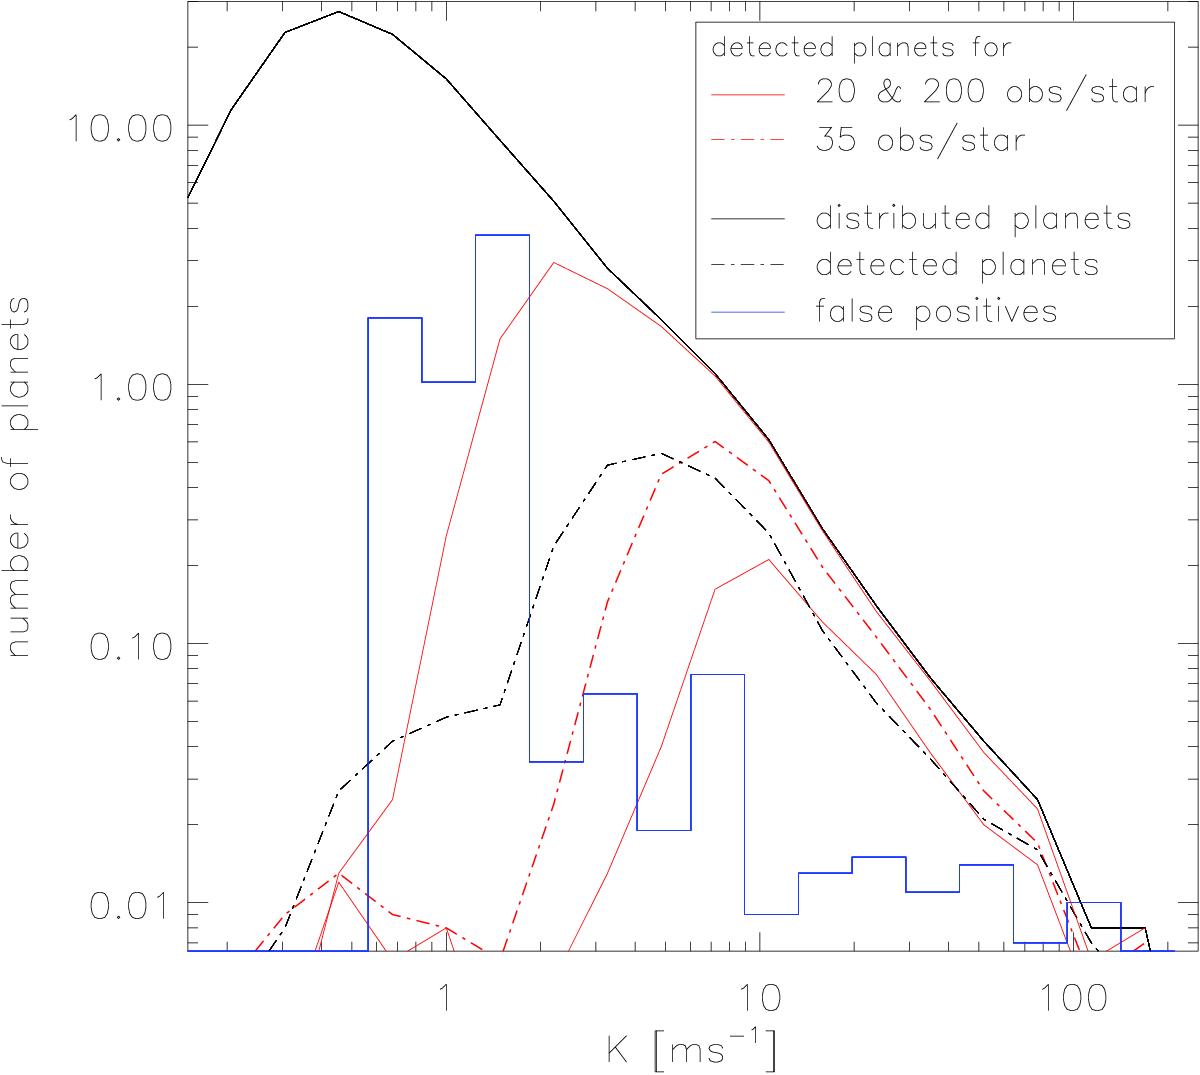
Histogram of RV amplitudes K, where the distribution for all simulated planets is shown by the solid black line with uncertainties of (0.97NP)0.5. We show the outcome of the simulations comparable to our observations (uneven 34.3 observations per star) of Sect. 3.2, where the black dash-dotted line indicates the planet detections and the blue histogram the false positives with uncertainties of (0.91NP)0.5. The red curves indicate the distributions for detected planets for 20 (bottom), and 200 (top) observations per star, the red dash-dotted line for even 35 observations per star (see Sect. 3.3). Uncertainties for all the curves of detected planets are in the order of (0.98NP)0.5.
Current usage metrics show cumulative count of Article Views (full-text article views including HTML views, PDF and ePub downloads, according to the available data) and Abstracts Views on Vision4Press platform.
Data correspond to usage on the plateform after 2015. The current usage metrics is available 48-96 hours after online publication and is updated daily on week days.
Initial download of the metrics may take a while.