Free Access
Fig. 1
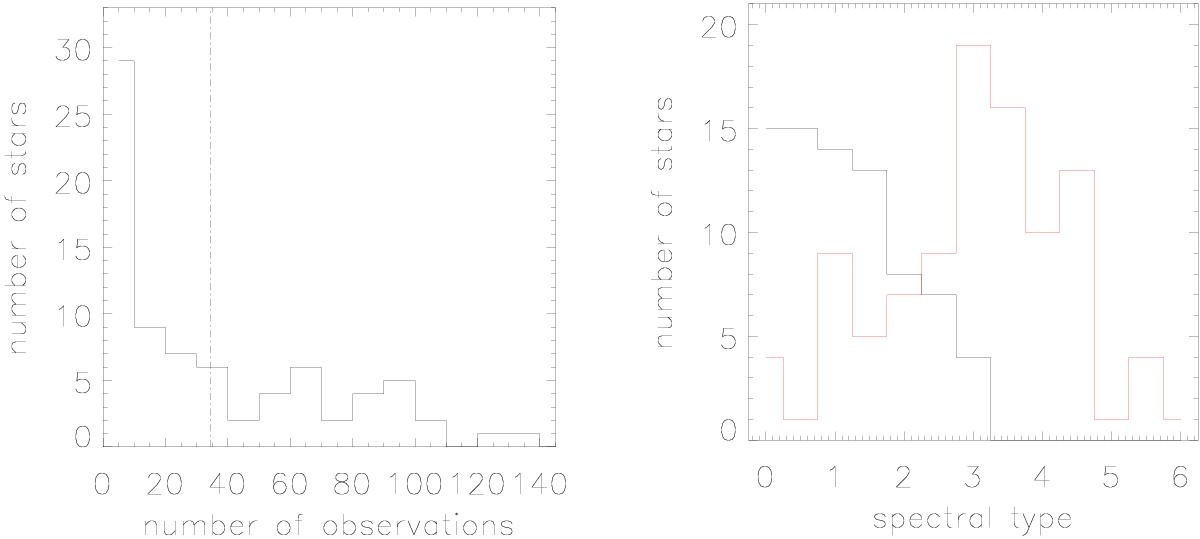
Left: distribution of the number of obtained spectra for our targets as of March 2016. The dash-dotted line indicates the average of 34.3 observations per star. Right: distribution of spectral types (M0 to M6) of our targets (black line) and Bo13 (red line).
This figure is made of several images, please see below:
Current usage metrics show cumulative count of Article Views (full-text article views including HTML views, PDF and ePub downloads, according to the available data) and Abstracts Views on Vision4Press platform.
Data correspond to usage on the plateform after 2015. The current usage metrics is available 48-96 hours after online publication and is updated daily on week days.
Initial download of the metrics may take a while.