Fig. A.1
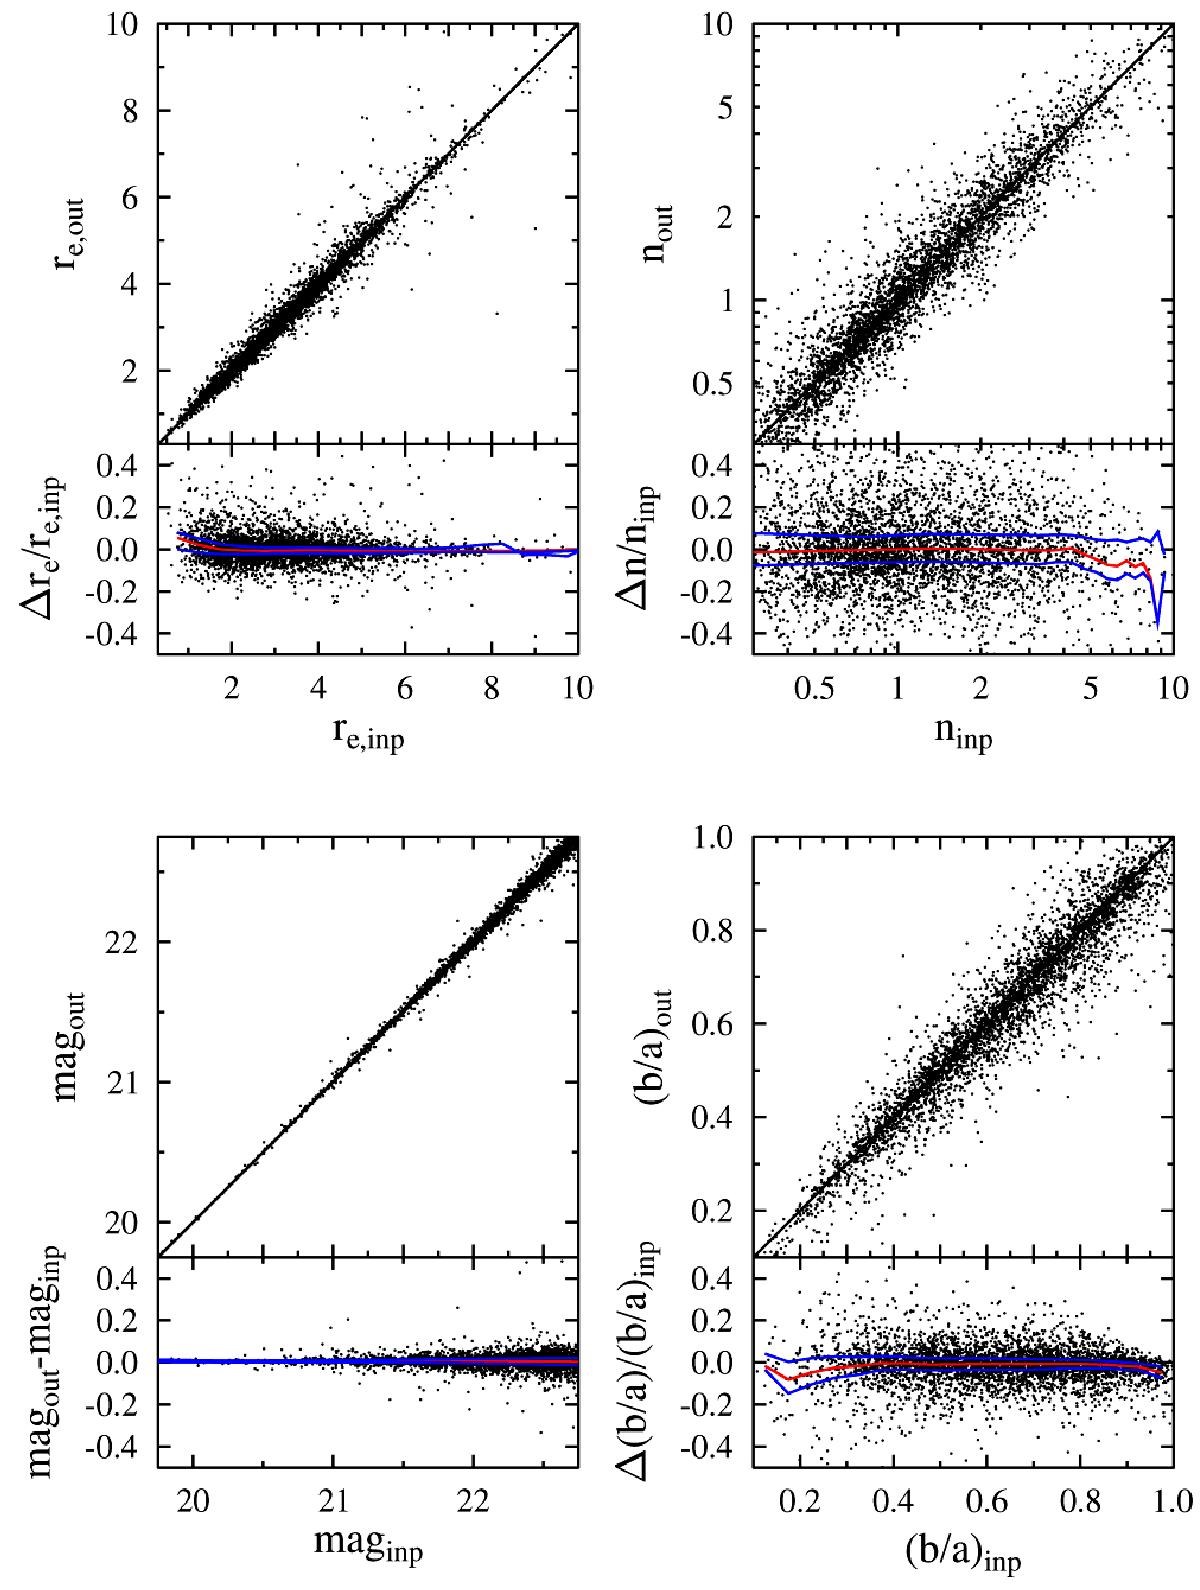
Comparison between Sérsic parameters of approximately 4000 simulated galaxies and their recovered values. Bottom plots show the fractional deviation of the parameters as a function of the half-light radius re in pixels, minor to major axis ratio b/a, and apparent magnitude m and Sérsic index n. The red line shows the median, whereas the blue line denotes the 1σ scatter around the median, defined to enclose 68% of the points at a given input value.
Current usage metrics show cumulative count of Article Views (full-text article views including HTML views, PDF and ePub downloads, according to the available data) and Abstracts Views on Vision4Press platform.
Data correspond to usage on the plateform after 2015. The current usage metrics is available 48-96 hours after online publication and is updated daily on week days.
Initial download of the metrics may take a while.