Fig. 8
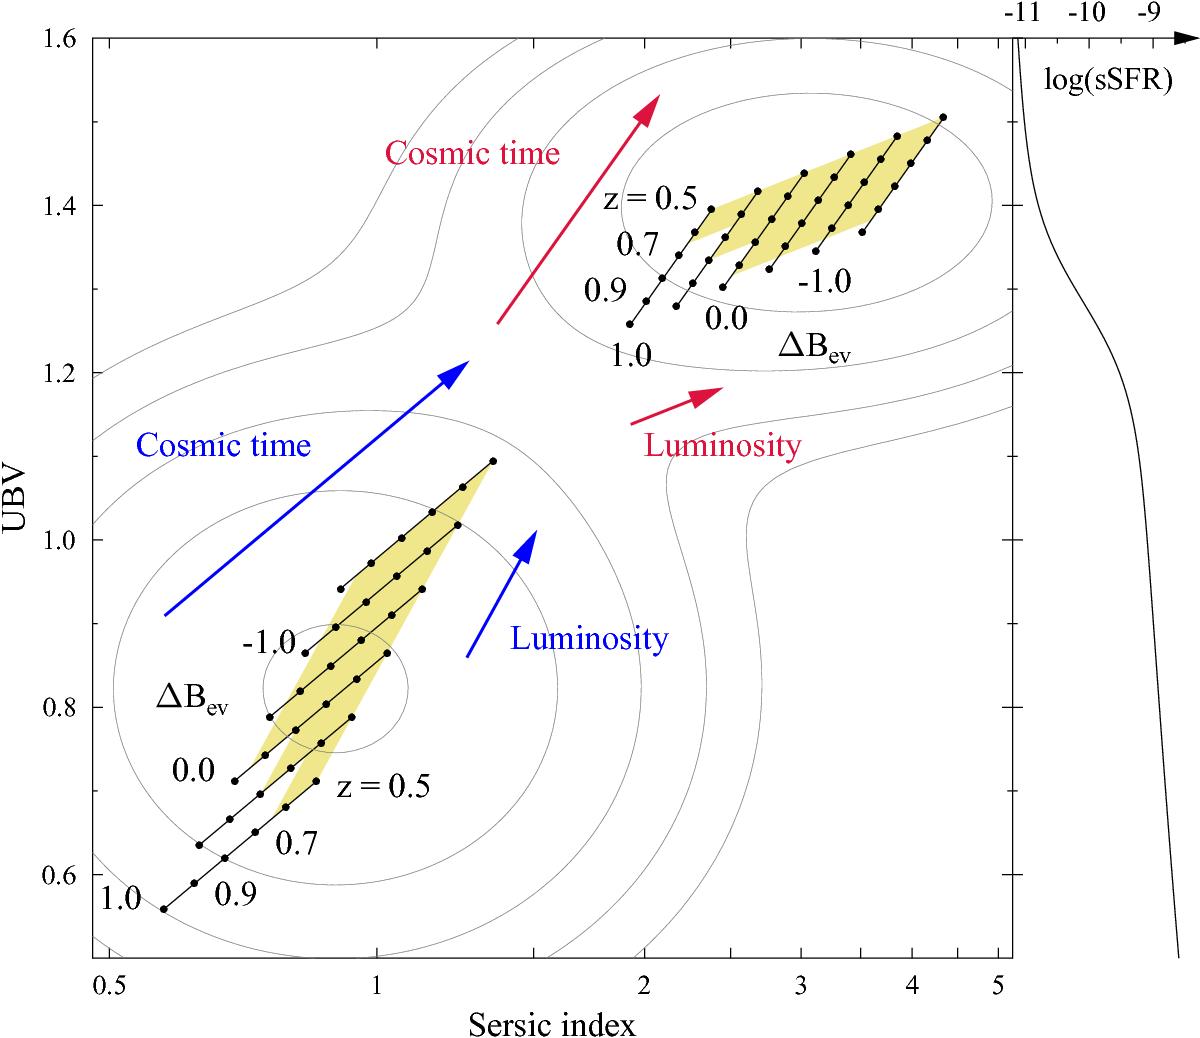
UBV rest-frame colour versus Sérsic index log (n) relation of late-type (lower left corner) and early-type (upper right corner) galaxies. Dots indicate redshift from z = 0.5 to 1.0 in increments of 0.1. Black solid lines connect the values of ΔBev from −1.5 to 1 in 0.5 magnitude increments. The arrows show the direction of the redshift and luminosity galaxy evolution. The right plot presents the UBV colour versus sSFR relation. The 0.2 dex background contour lines show the bivariate number density of all studied VIPERS galaxies in our sample (0.5 <z< 0.95). The yellow coloured regions mark the analysed redshift and luminosity limits, as presented in Figs. 1 and 7.
Current usage metrics show cumulative count of Article Views (full-text article views including HTML views, PDF and ePub downloads, according to the available data) and Abstracts Views on Vision4Press platform.
Data correspond to usage on the plateform after 2015. The current usage metrics is available 48-96 hours after online publication and is updated daily on week days.
Initial download of the metrics may take a while.